


Recapping the March 14-16 Event: Part 3
March 16 and an overall review
As a quick reintroduction for those who didn’t see part 1 or part 2 of this article, this is an experiment with trying a long form, chronological recap of the major March 14-16 weather event from a more technical perspective. One of my goals with Balanced Weather is to provide to those interested some kind of behind the scenes perspective on meteorology and the science that goes into forecasts and warnings. If this is of interest to you, read on - and please provide any comments, questions or suggestions in the comment section at the end.
Sunday March 16
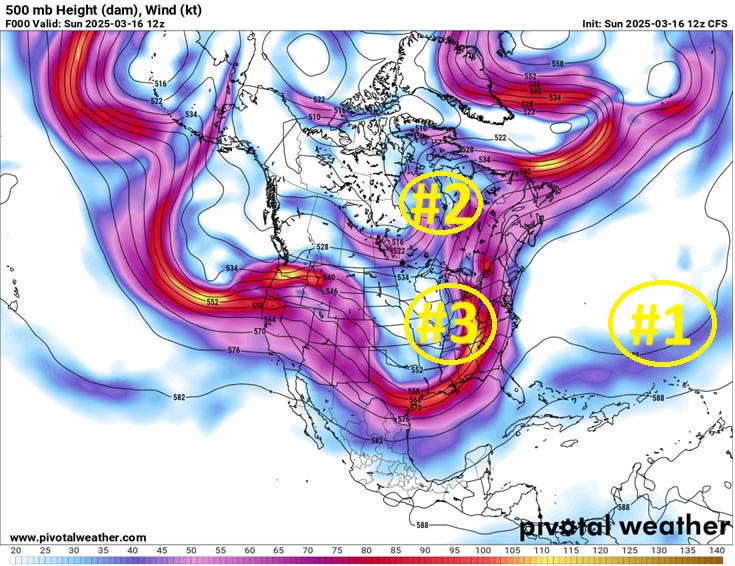
For the last time in this series, we look at the morning 500 mb chart. Our first two systems have now exited the picture, #1 weakening over the central Atlantic and #2 now over Hudson Bay. Our focus for the day is on impulse #3 which is lifting northeast through the lower Ohio Valley.
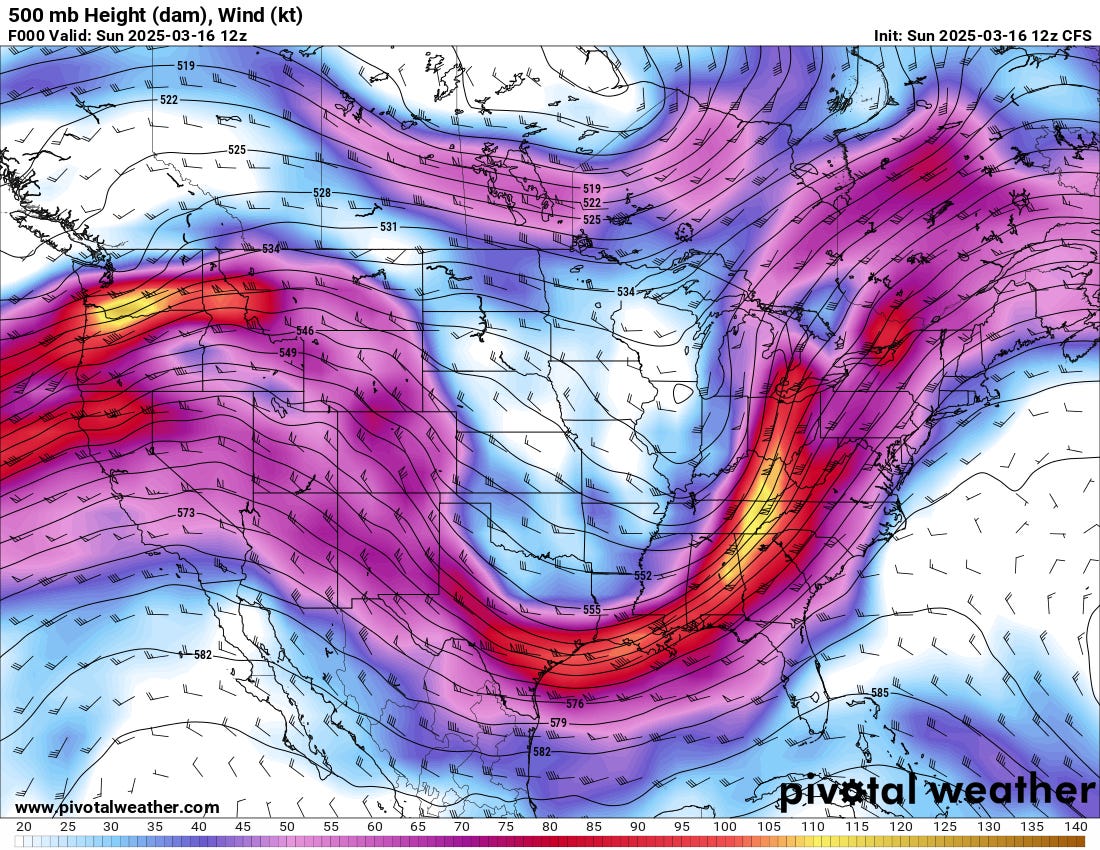
If we zoom in a bit more closely, we can see that there is 120 kt wind maximum on the east side of that trough that will be punching into eastern Ohio and western Pennsylvania over the next several hours. This will be the area of focus for severe thunderstorms.
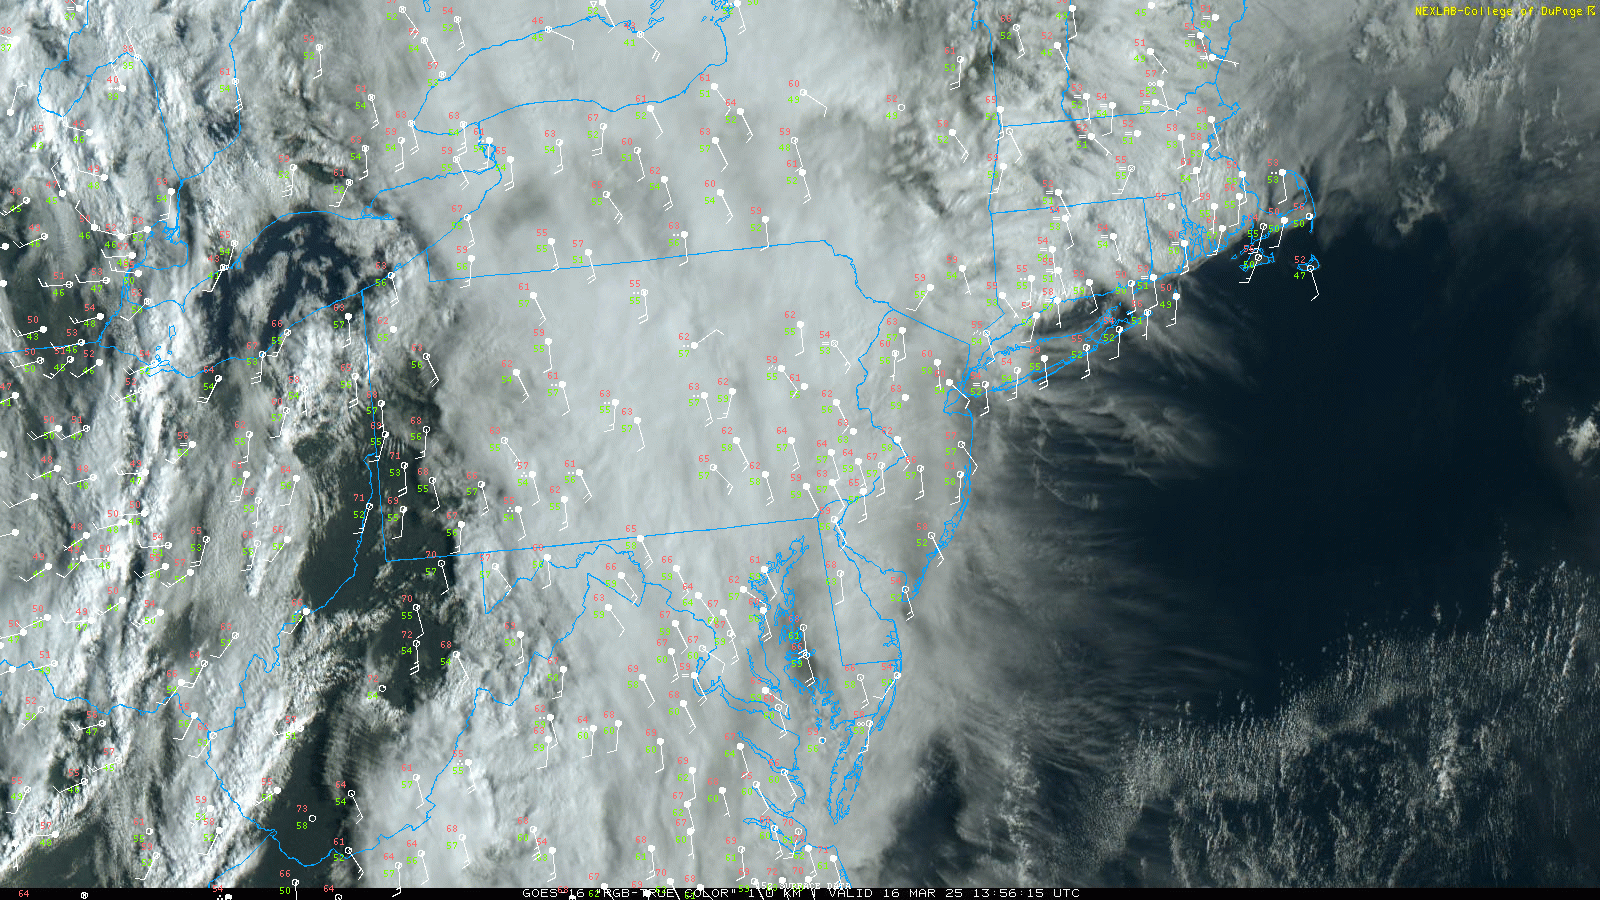
At 10 am ET as that upper level system and associated wind maximum was moving into the region, visible satellite showed bands of convection developing over Ohio while some sunshine was breaking out over extreme eastern Ohio into western Pennsylvania. As I talked about in that morning’s Balanced Weather post, low level moisture was limited, so some daytime heating was helpful in destabilizing the atmosphere across the region. The combination of the impulse, the front, and some modest instability set the stage for a line of strong to severe thunderstorms.
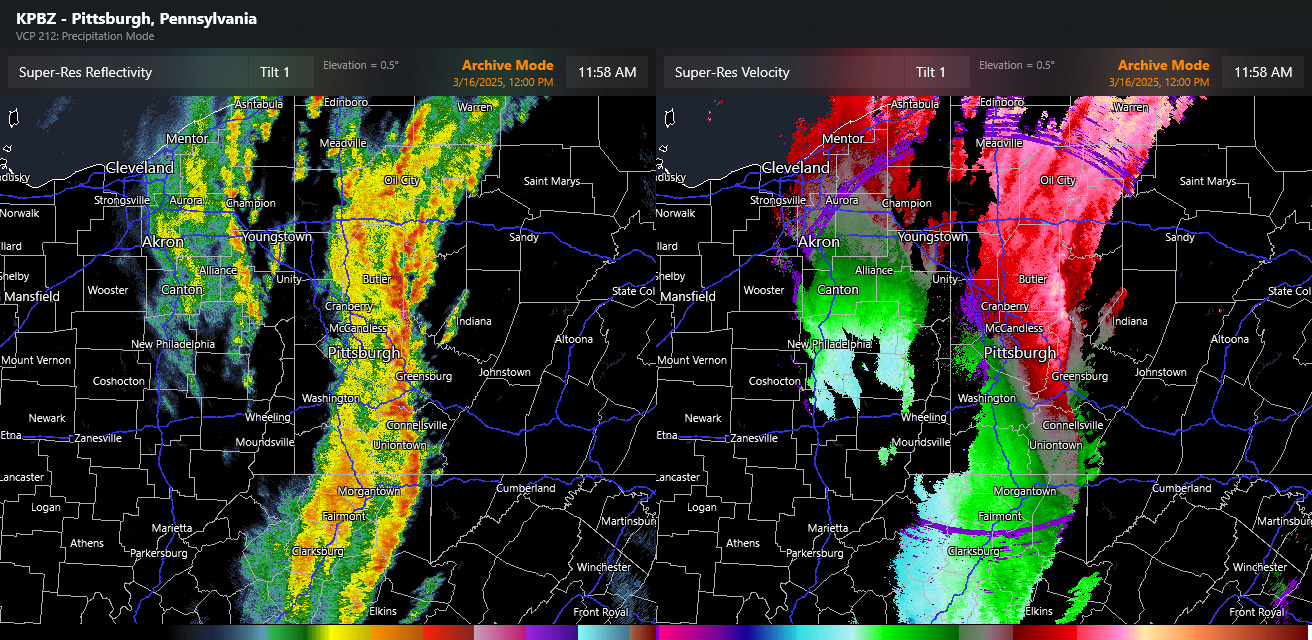
By midday, the primary line of severe storms had formed over western Pennsylvania, where some sunshine had boosted temperatures into the lower 70s in spots. Along with helping to boost instability, the warmer surface temperatures likely helped the storms transport the stronger winds aloft in the atmosphere down to the surface.
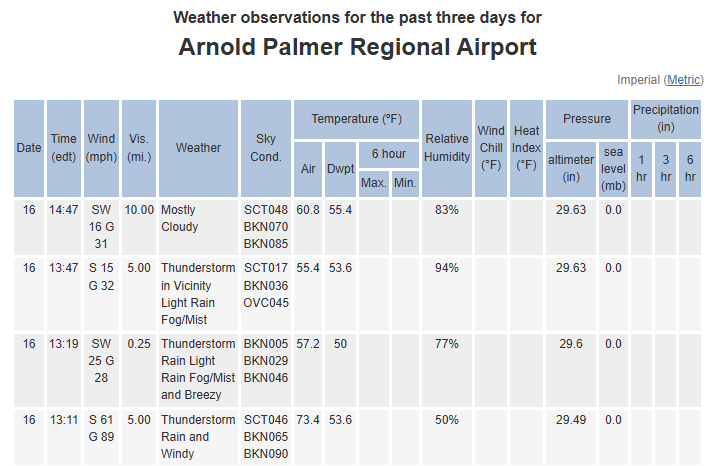
A prime example of this can be seen at the observing site in Latrobe, where temperatures warmed to 73F ahead of the storms, and then a wind gust to 89 mph was reported as the line moved through.
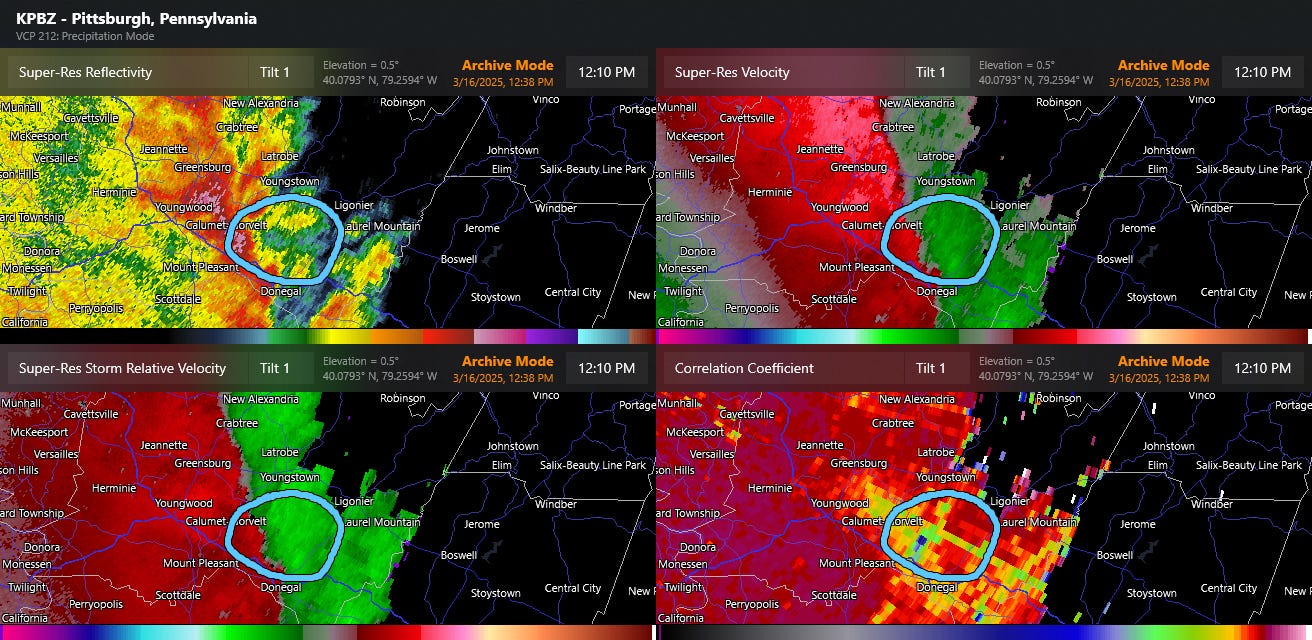
As the line approached Latrobe as seen above, you can also see some subtle areas of rotation along the line. These small scale vortices can produce tornadoes, and in this case NWS Pittsburgh confirmed a few EF-1 tornadoes in Westmoreland county with this evolution. Well organized “mesovortex” features with quasi-linear convective systems - or QLCSs - can produce significant tornadoes when conditions are favorable; in this case, the tornadoes were weaker and relatively brief.
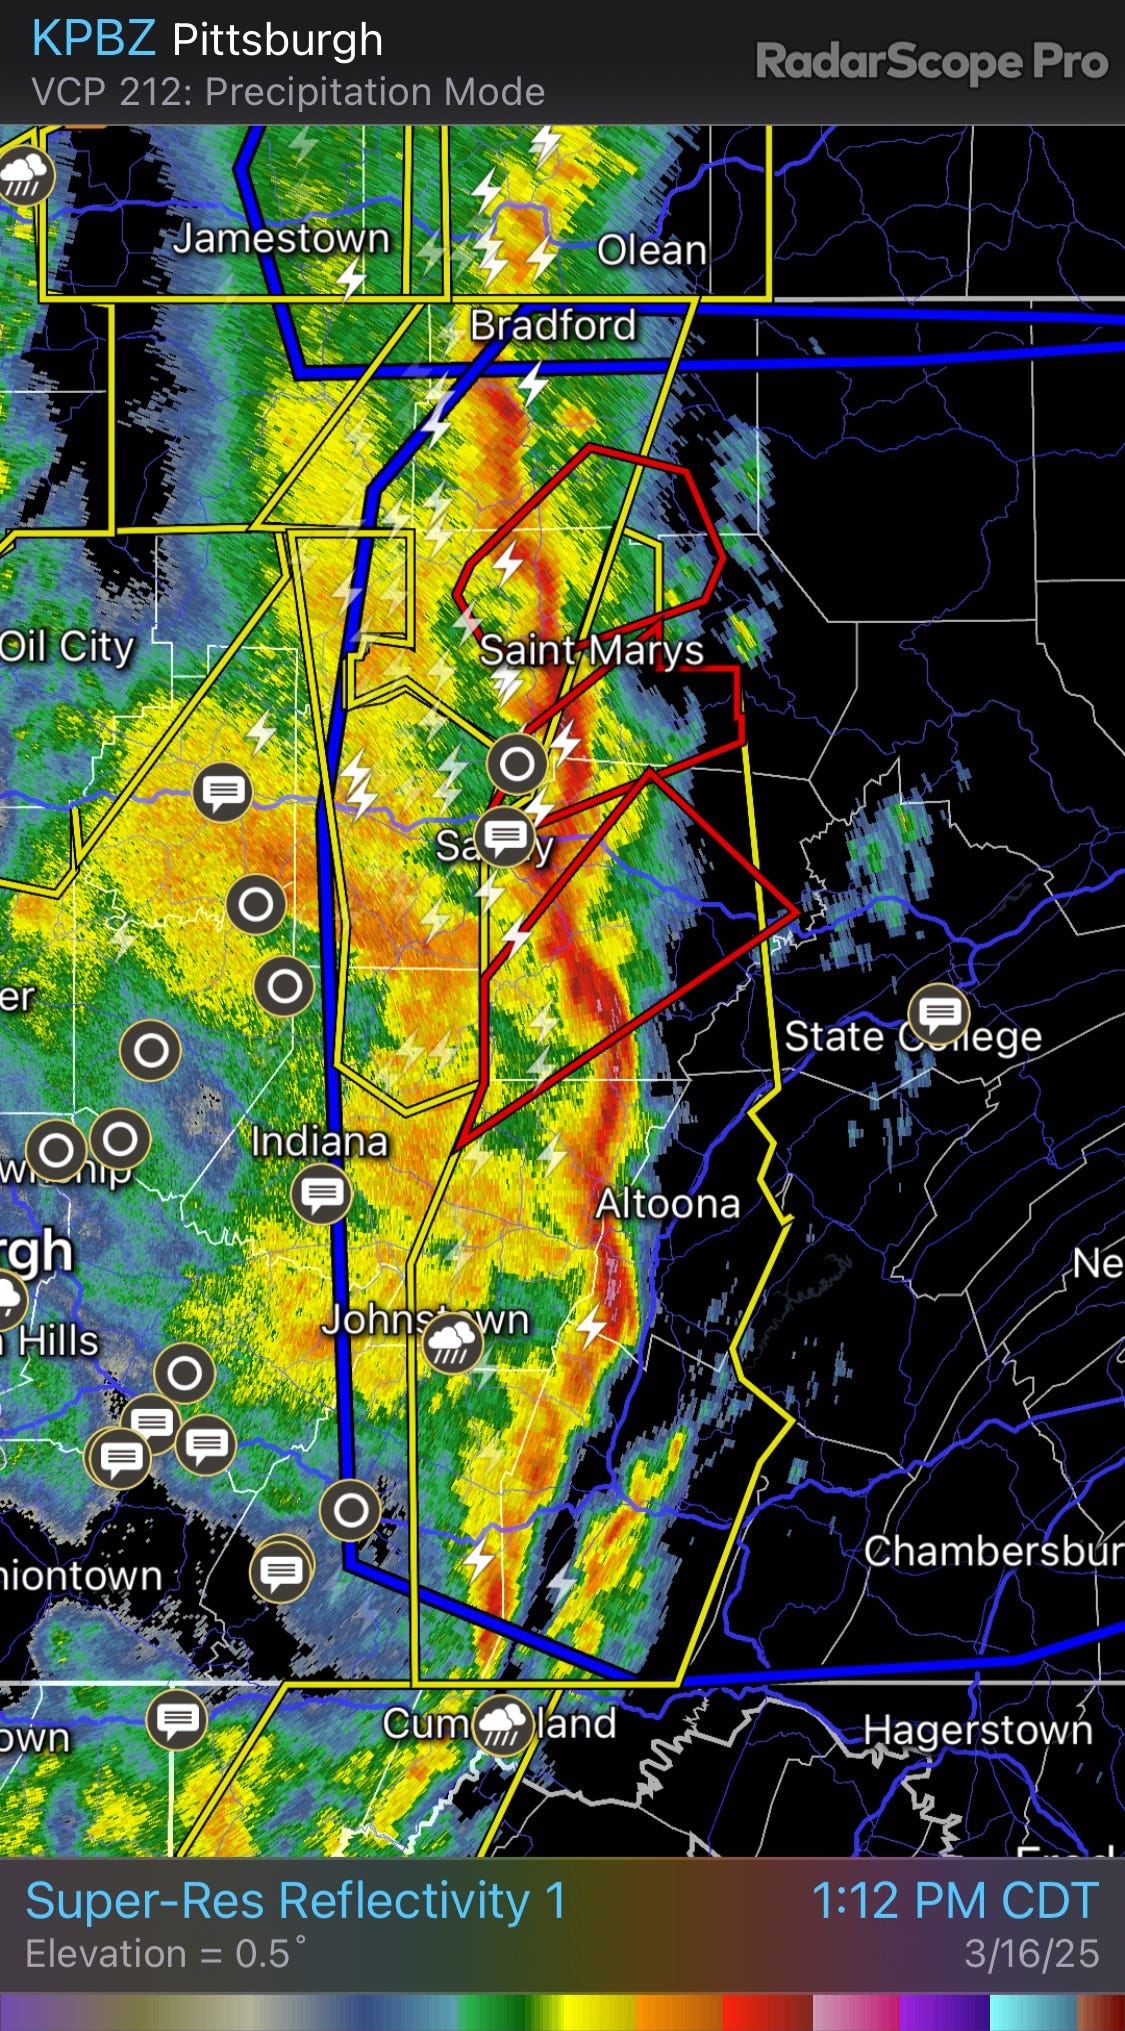
The line of storms remained well organized as it moved east into central Pennsylvania, and numerous reports of damaging winds were received. The line also produced extensive wind damage across parts of upstate New York, West Virginia, and eastern Ohio (see below).

The line of storms eventually weakened as it moved farther east into less favorable conditions. But the system wasn’t done yet!

Later that evening and into the overnight hours, some strong to severe storms moved across parts of North Carolina, and just before the last bands moved offshore (and system #3 finally exited stage right), a supercell storm (circled above) produced an EF-1 tornado southwest of Elizabeth City around 3 am ET. Unfortunately, this tornado impacted a number of trailers and mobile homes, and 8 people were injured.
Event Summary and Verification
NWS and emergency management officials are still tallying the damage and impacts from this massive weather event, and will be for many days more. Media reports indicate that at least 43 people died either directly from the weather or related impacts and more than 100 were injured.


SPC logged approximately 1500 reports of severe weather over the 3 day period March 14-16. While surveys are still continuing, around 100 tornadoes have been confirmed to this point, including 3 violent EF-4 tornadoes (Larkin, AR; Diaz, AR; Kentwood, LA-Tylertown/Collins, MS), and approximately two dozen of the weather related fatalities noted above were direct tornado fatalities.
Overall, forecasts for this event appear to have been excellent. SPC began outlooking severe weather and fire weather areas several days before the event began.
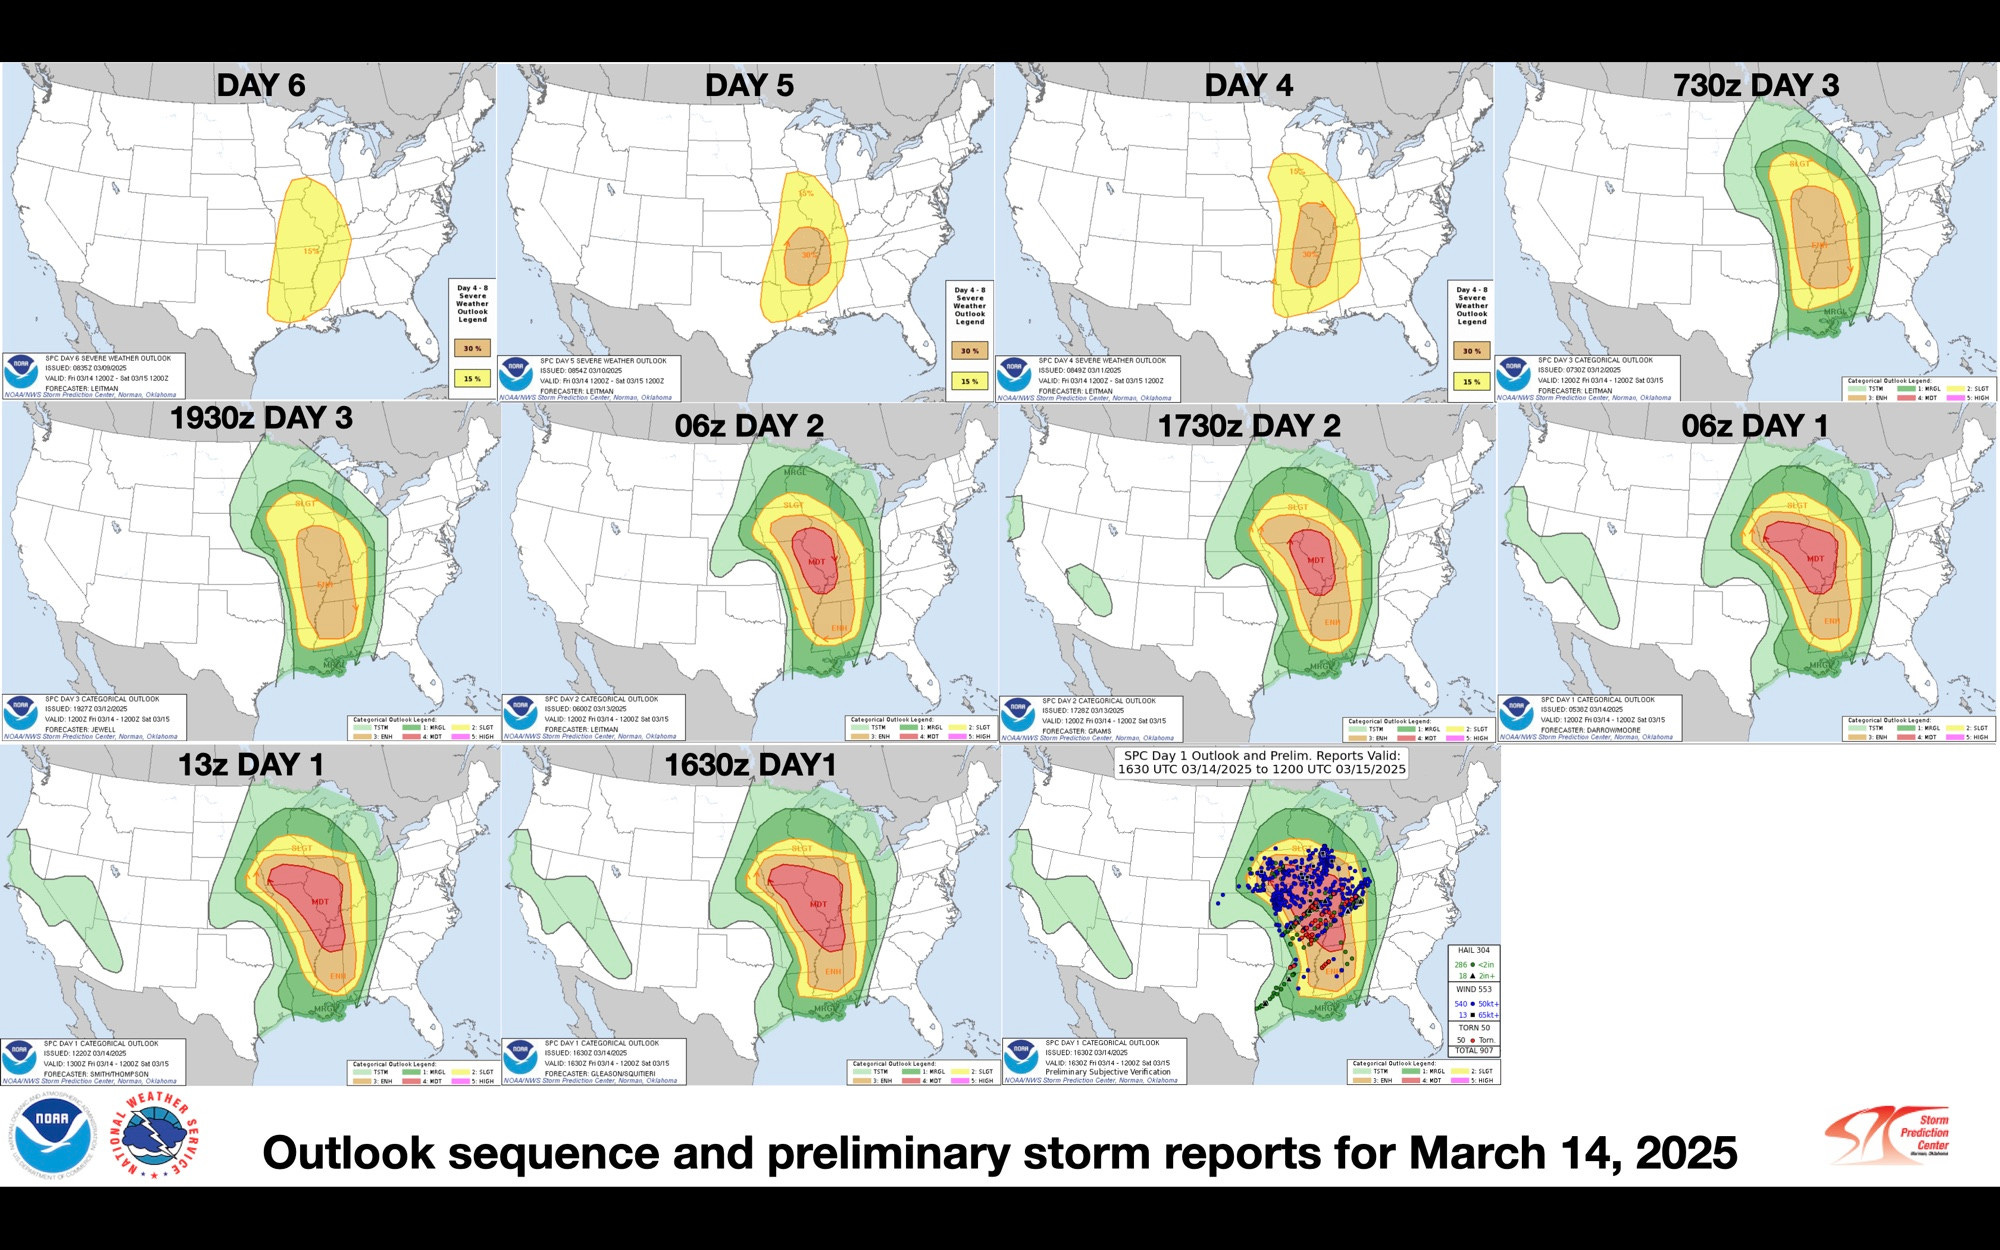
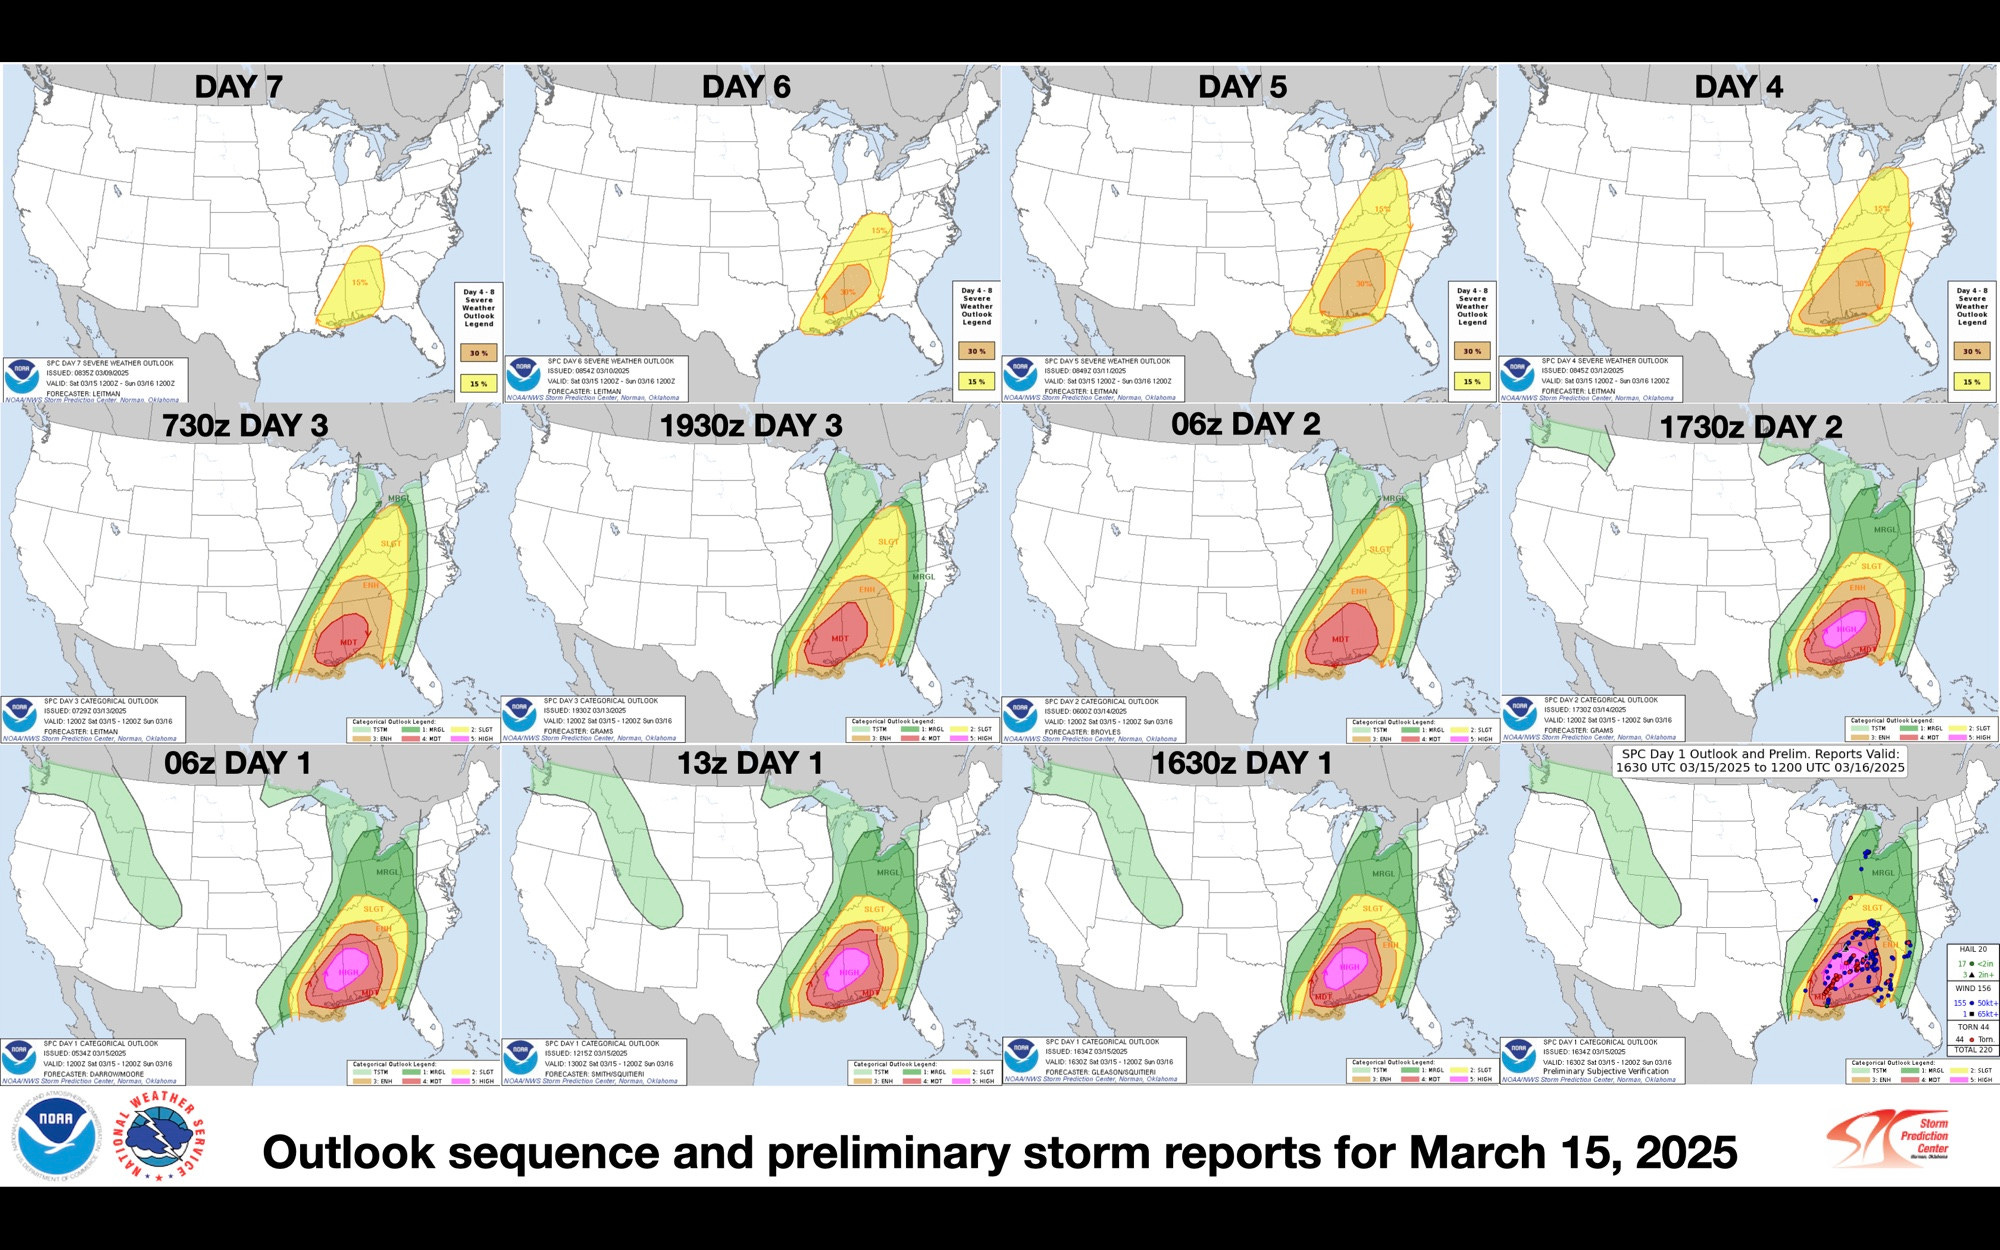
As can be seen in this sequence of SPC convective outlooks leading up to March 14 and 15 (courtesy Liz Leitman on BlueSky), the overall areas of the severe weather outbreaks on both days were quite well identified a week in advance, and identified the maximum areas of impacts with moderate and high risks as the events approached.
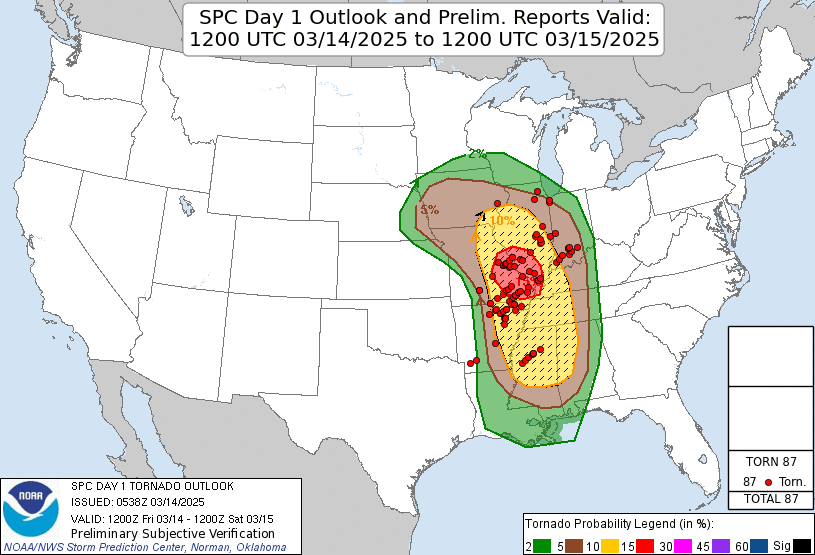
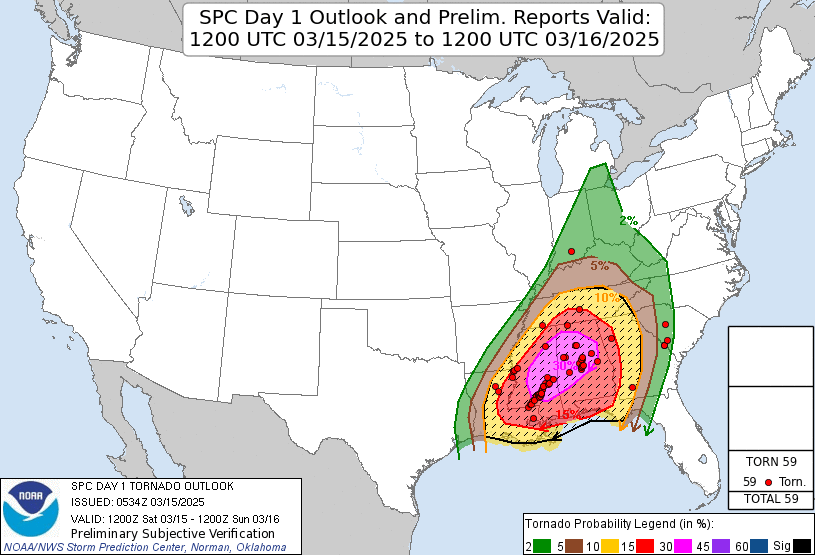
These graphics show the subjective verification of SPC’s tornado forecasts for each day. From a subjective standpoint, overall the forecasts appear to have performed very well, identifying the areas of greatest impact. But because these forecasts are probabilistic, we do not have to rely on subjective verification; we can look at the verification objectively as well.
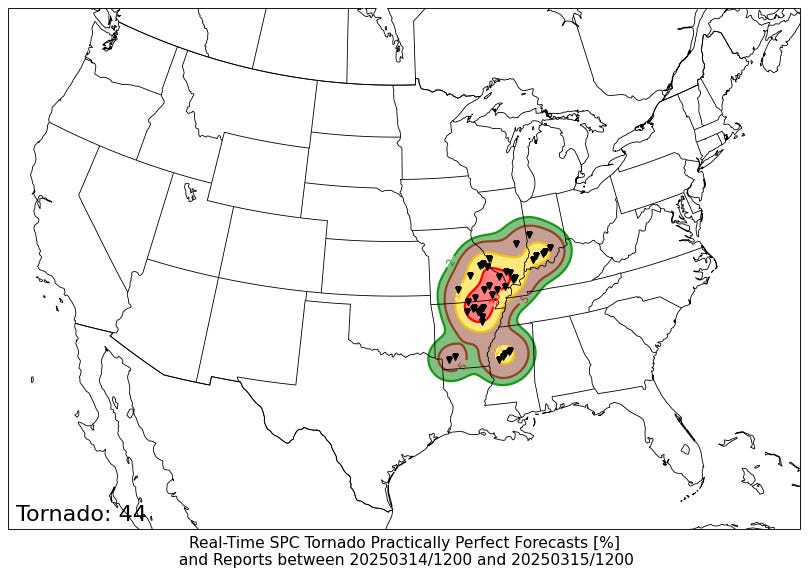

These graphics show the actual computed probabilistic coverage of tornadoes for March 14 and 15 using a “practically perfect forecast” (PPF) technique from Saint Louis University, essentially using the observed tornadoes to produce what the probabilistic forecast should have been if it were perfect. When you compare the PPFs to the actual forecasts, while you can see some small differences between forecast and verification (e.g., the forecast 15% area on March 14th should have extended into Arkansas, the forecast 30% area on March 15th extended too far north in Alabama), overall the forecasts were excellent. SPC high risk forecasts always receive a lot of scrutiny in the meteorological community; the objective data would suggest the high risk in this case was overall warranted, and in fact due to the repeat tornadic supercells in southern Mississippi that area verified well above the 30% high risk threshold. For what it’s worth, I will add that subjectively, as someone who has been deeply involved in severe weather research and operations for 35 years, Saturday “felt” very much like a high risk event to me.
While all weather forecasts are inherently probabilistic, forecasting severe thunderstorms and tornadoes must use a probabilistic approach given that we are trying to forecast the impacts of small scale phenomena at specific points. Furthermore, severe convection evolves rapidly and is influenced by a myriad of factors from large scale down to the scale of cloud physics. As an example, even as Saturday’s event was unfolding, the various high resolution models showed a variety of ways in which storms across Mississippi and Alabama might evolve, from a primary single intense line of storms with very few storms ahead of the line (a much less tornadic solution) to an evolution with numerous supercell storms (historic tornado outbreak). The truth ended up being somewhere in between, where the storms were loosely organized but remained semi-discrete and not in a solid line, allowing for a number of significant, intense tornadoes. Overall, the probabilistic forecasts did an excellent job for this episode in providing guidance on the coverage and intensity of severe storms and tornadoes.
That wraps up this three part summary of the March 14-16 weather event, tracked from all the way back to when “system #3” was southwest of Alaska to when it was exiting out over the Atlantic. I would welcome questions, comments, etc. in the comment section; any feedback would be useful as I try to determine the best way for Balanced Weather to help people understand the science of meteorology and how to better understand and use weather information.