


Recapping the March 14-16 Event: Part Deux
March 15
As a quick reintroduction for those who didn’t see part 1 of this article, this is an experiment with trying a long form, chronological recap of the major March 13-16 weather event from a more technical perspective. One of my goals with Balanced Weather is to provide to those interested some kind of behind the scenes perspective on meteorology and the science that goes into forecasts and warnings. So if this is of interest to you, read on - and please provide any comments, questions or suggestions in the comment section at the end.
Morning of Saturday, March 15

As far as sensible weather was concerned, Saturday morning started off with a band of strong to occasionally severe thunderstorms running from west central Louisiana to southwest Tennessee.
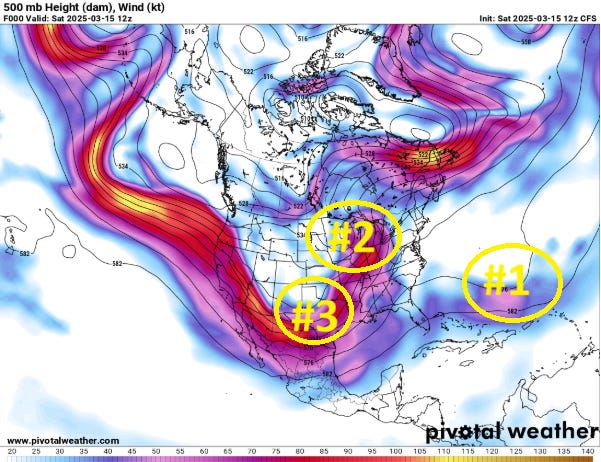
Looking at the atmospheric forcing in the mid and upper levels by going to the 500 mb chart as we did in part 1, we can see that system #1 has now moved well out into the Atlantic and was no longer much of a player in this event other than the residual effect on moisture return we will discuss in a bit. System #2, the main driver for the dust/fire weather Friday and severe weather Friday night had lifted in the western Great Lakes. Often when a major weather disturbance like #2 ejects out through the Midwest, it is a “one and done” kind of situation, but not in this case. System #3, which we followed from the northwest Pacific, has dropped in right behind system #2 and is now in a very similar position to where system #2 was at this same time on Friday. It is now ready to eject northeast and play a similar role in forcing severe weather as system #2 did 24 hours earlier.

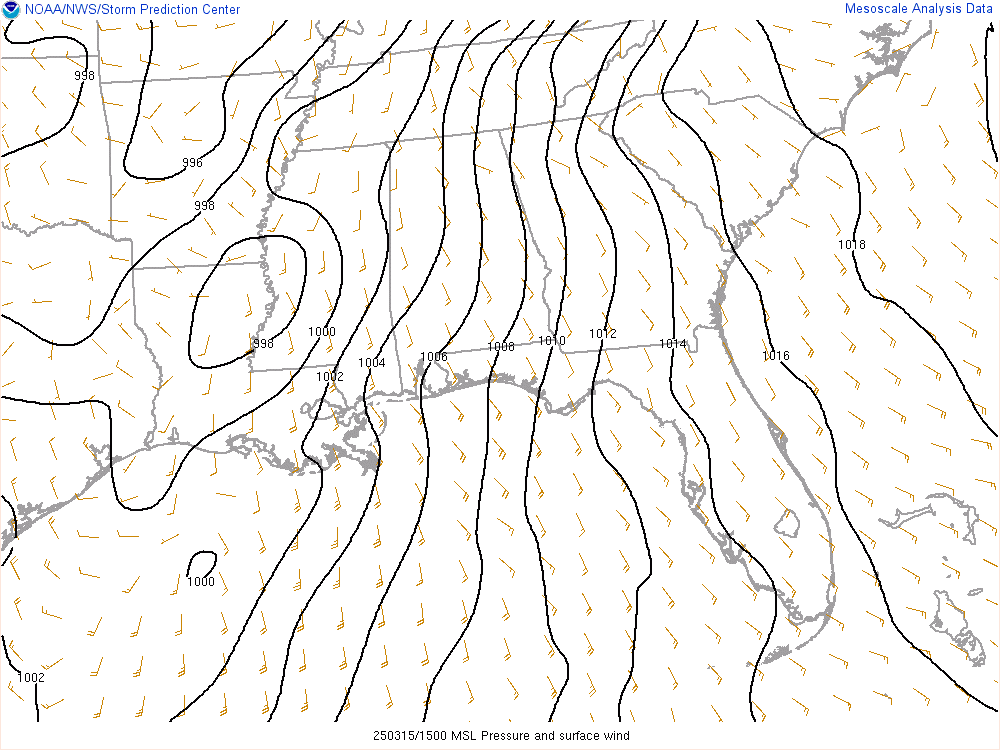
Even though the track of system #3 will be relatively similar to that of system #2 - a bit farther south - this map depicting low level moisture Saturday morning shows why the storms on Saturday were focused farther south than those Friday. I’ve drawn in the 60F dewpoint line on this map of 7 am dewpoints. Dry air has overspread most of the area northwest of this line, meaning that the favorable low level moisture and instability for severe storms will be focused across Mississippi and Louisiana. A wedge of cooler and drier air has moved south along the Appalachians into Georgia and eastern Alabama in the wake of system #1, and the winds between the 3 systems will keep that air recirculating in the same area much of the day Saturday, until the flow associated with system #3 becomes dominant and Gulf moisture can spread north into eastern Alabama and Georgia. This moisture distribution as well as the atmospheric forcing being focused more to the northwest is why storms remained in that same area from Louisiana into the Tennessee Valley for many hours on Saturday.
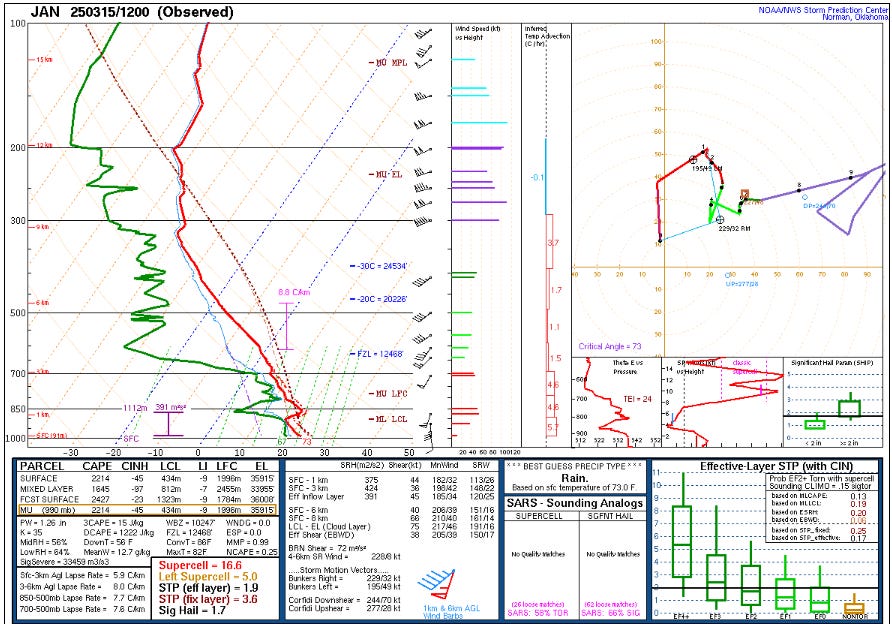
Some of the key data that meteorologists look at to diagnose severe weather potential are the plots from the weather balloon data gathered at upper air observation sites. The chart above is the Skew-T/Log-P diagram from Jackson, MS from their 7 am balloon release Saturday. The Skew-T is the primary chart used by meteorologists to analyze this “sounding” data; the red line is the temperature the balloon sensed as it rose, the green line is the dewpoint, winds are plotted at various levels with height on the right side of the chart. The values are plotted based on their pressure in the atmosphere, shown on the far left side of the chart. A number of important parameters for forecasting thunderstorms, severe weather, etc. are derived from the data and placed in the table at the bottom of the chart.
This particular sounding reveals an atmosphere very favorable for severe thunderstorms and tornadoes. The low level atmosphere is very moist up to about 900 mb (about 3,000’ AGL). At that point, there is an “inversion” where the temperature actually increases with height for a short distance up to about 850 mb, above which the cooling with height is greater than usual. This type of environment is very favorable for severe thunderstorms because the greater cooling provides more instability to the atmosphere, while the inversion around 850 mb provides a “cap” which keeps thunderstorms from developing too rapidly or too prolifically to prevent individual thunderstorms from growing intense. Meteorologists refer to a Skew-T that looks like this one as a “loaded gun” because it shows the atmosphere is already prepped for significant severe weather.
The wind shear in the atmosphere is summarized in the middle table at the bottom of the chart. Forecasters look at both “helicity” - which is a measure of the shear and the change in wind direction with height - and bulk shear - which is the bulk difference between the wind vector at two different levels - to help gauge the potential for tornadoes. The values shown on this Jackson sounding are extremely favorable for tornadoes; for example, the 0-1 km shear threshold for significant tornadoes is generally 20-25 kt, and the Jackson sounding is showing 44 kt. The approach of system #3 was only expected to make the wind shear stronger across the region through the day.
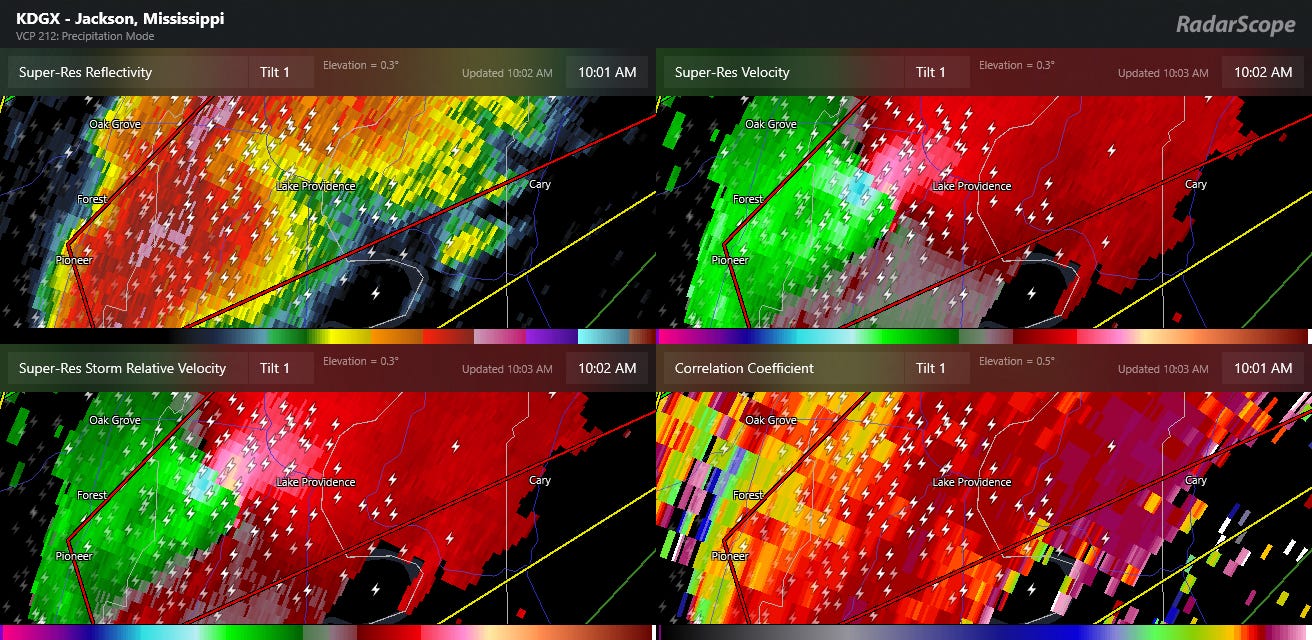
By late morning, the approach of system #3 and persistent thunderstorm activity in the Arklamiss region supported the development of a small area of low pressure - a “mesolow” - in Northeast Louisiana. A more defined supercell storm developed in conjunction with this, and by 10 am it had intense rotation as it approached the Mississippi River north of Lake Providence, LA (below).
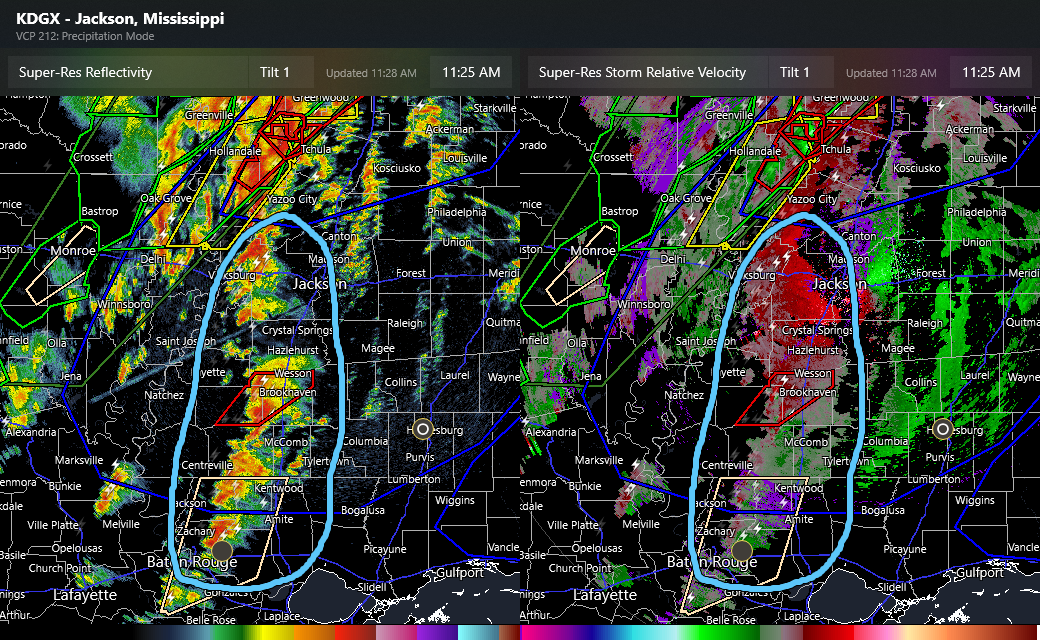
The supercell maintained this impressive rotation well into Mississippi, the 10:45 am CT 4-panel radar from Jackson below showed very impressive rotation between Hollandale and Anguilla.

This storm produced an EF-2 tornado in Issaquena and Sharkey counties in Mississippi, causing some injuries near the community of Grace. Interestingly from a meteorological perspective, it did not ever produce a tornadic debris signature (TDS) as discussed in part 1 of this article; this is likely because the tornado was passing through a sparsely populated area with limited trees which likely precluded sufficient debris to be lofted and detected by radar.
Saturday Afternoon
While the original supercell continued to move into northern Mississippi and become less of a tornadic threat, by midday new supercells had developed in a band along I-55 from Hazlehurst to northeast of Baton Rouge.

The Warn-on-Forecast (WoFS) modeling system is a high resolution atmospheric modeling system run by the National Severe Storms Laboratory (NSSL) to experiment with producing useful guidance about individual severe thunderstorms at lead times longer than current severe thunderstorm and tornado warnings. WoFS output is provided to NWS forecasters and the broader community in real-time when the system is being run. WoFS was run during this event, and the graphic above is the WoFS 90 minute forecast of Significant Tornado Parameter (STP) for Noon CT. STP is a parameter that combines atmospheric instability and wind shear into a single parameter to give meteorologists a quick idea of the how favorable the atmosphere is for tornadoes. Values greater than 5 are quite high and indicative of the potential for significant tornadoes. So given that this was the environment these supercells were moving into and combined with favorable support, these supercells were extremely concerning for potentially intense, long-tracked tornadoes. SPC issued a mesoscale discussion around Noon highlighting this potential (below).
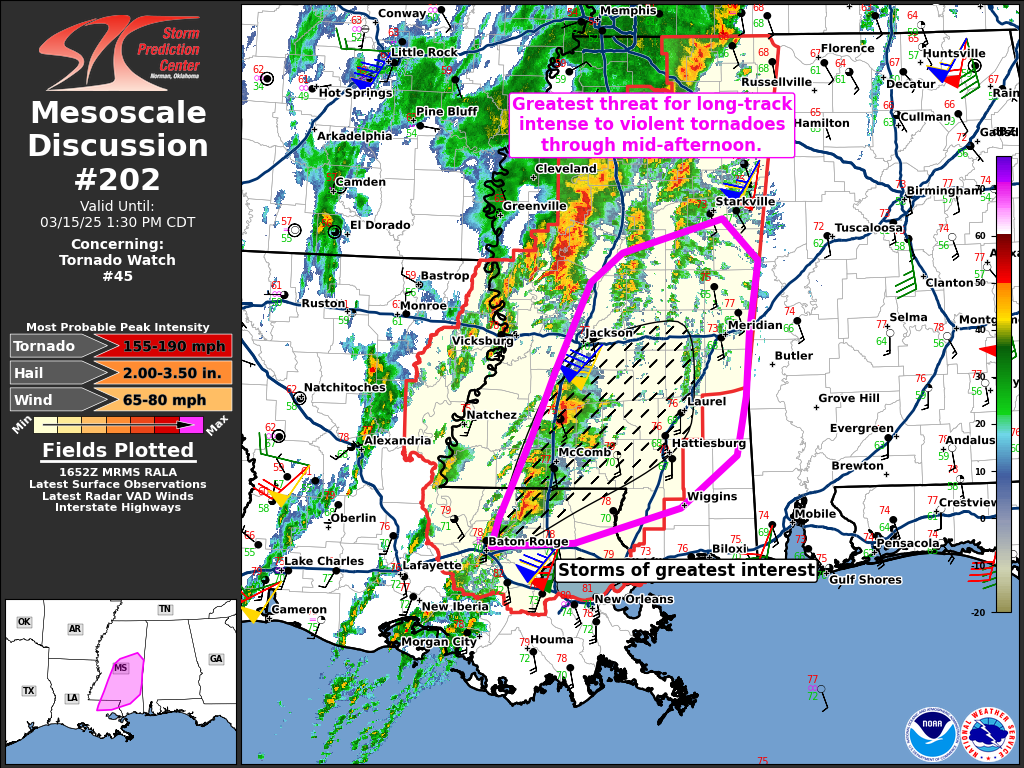
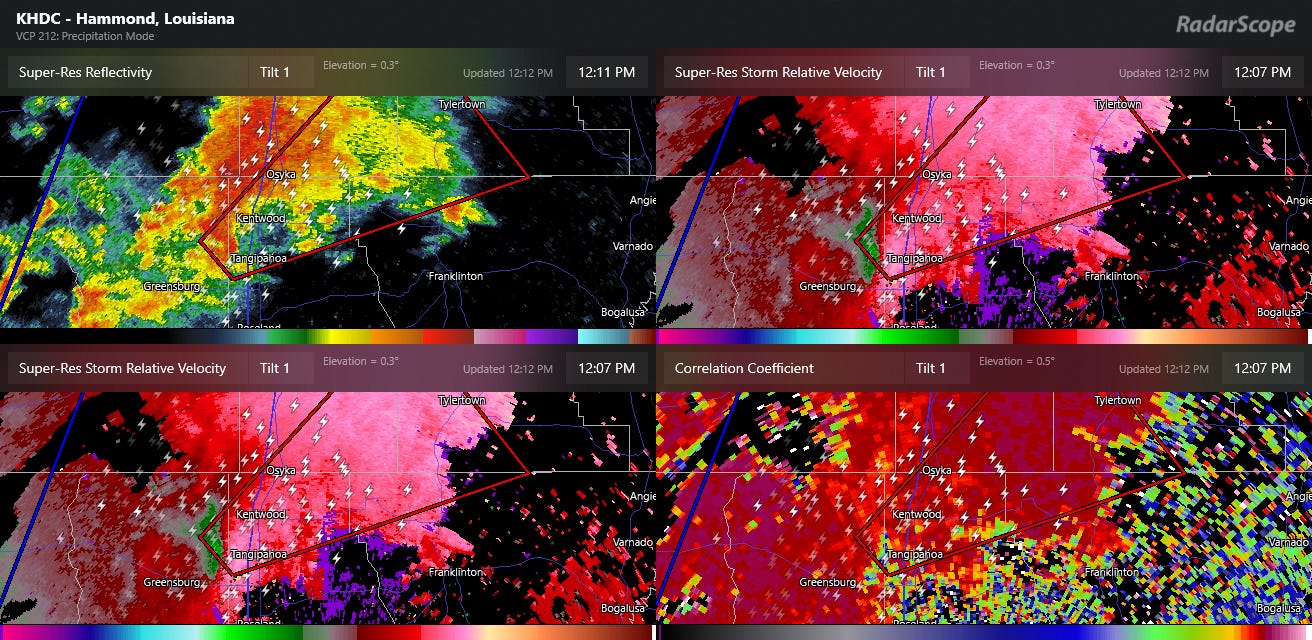
Shortly after Noon, a well defined supercell intensified along I-55 near Kentwood and Tangipahoa in Louisiana and was tornado warned by the NWS office in Slidell (above). It continued to intensify and by 12:23 pm CT it had a TDS as shown below.
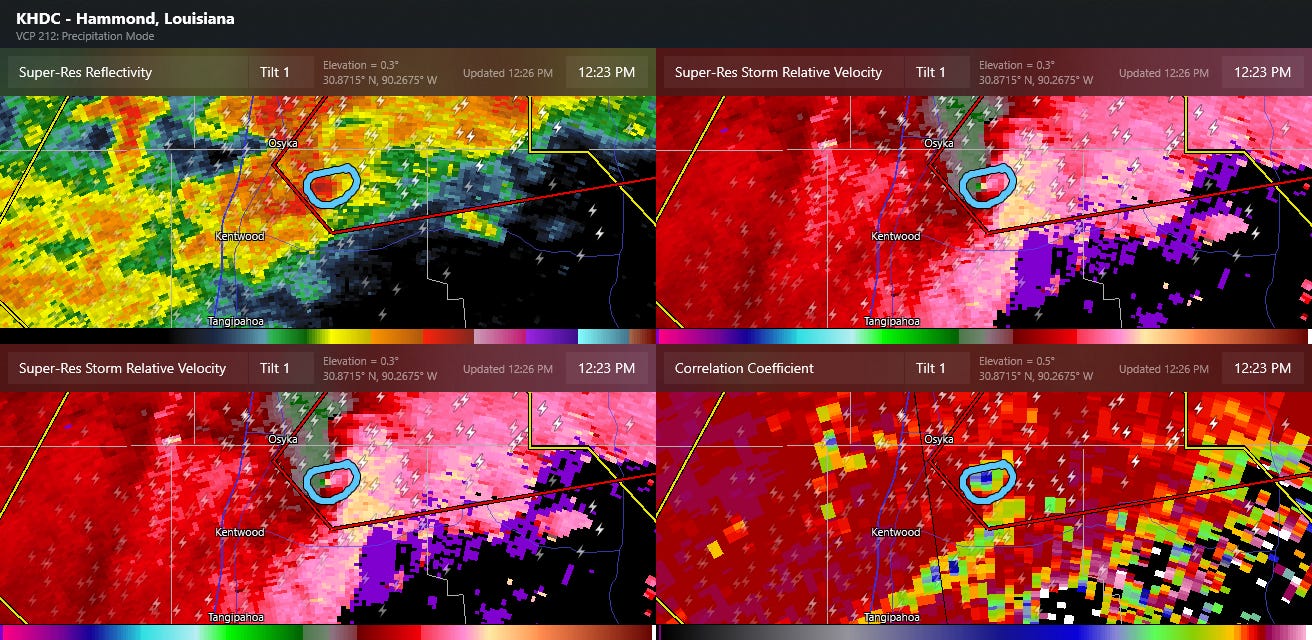
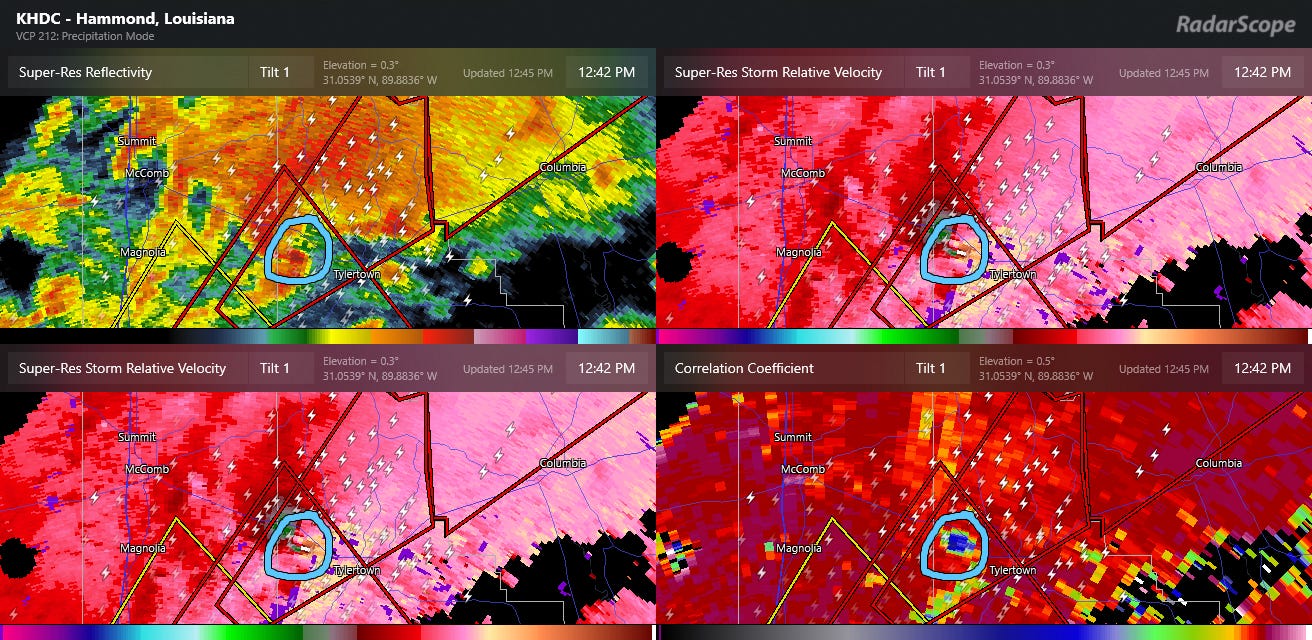
By 12:42 pm (above), as it passed west of Tylertown, MS it not only had intense rotation and a TDS off of the Hammond, LA WSR-88D weather radar, it also showed increased reflectivity values indicative of a “debris ball” signature as shown in the upper left hand image above in the blue circled area. All of the discussion points above about the potential for long tracked, intense tornadoes came to fruition with this tornado, as the preliminary surveys from the Jackson and Slidell NWS offices show that this tornado was a violent EF-4 tornado that was in progress for 80 minutes, traveling 65 miles from just northeast of Kentwood, LA to just west-southwest of Collins, MS. Unfortunately, 5 people lost their lives in this tornado.
A trailing supercell coming up from the southwest behind this initial supercell produced a second strong tornado with a TDS, this loop of correlation coefficient captured by Dr. Tony Lyza shows both tornadoes with their TDSs. NWS rated this second tornado as an EF-3 that had a path length of just under 25 miles.
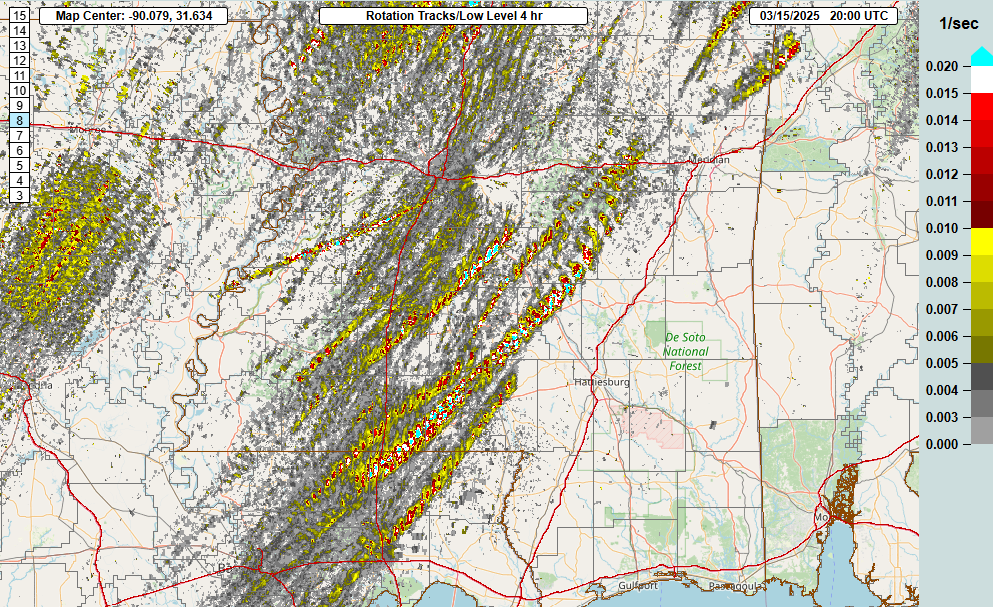
The MRMS 4-hour rotation tracks product ending at 3 pm CT shows that multiple supercells with intense low level rotation moved across the same area of southern Mississippi and eastern Louisiana during the early afternoon. This was the main focus for significant tornadoes during this timeframe.
While repeated strong to severe storms had moved across northern Mississippi and western Alabama during this timeframe, only a few brief tornadoes had occurred. Conditions finally became more favorable by late afternoon, especially in northwest Alabama, where this supercell (below) rapidly evolved and produced an EF-2 tornado near Gordo.
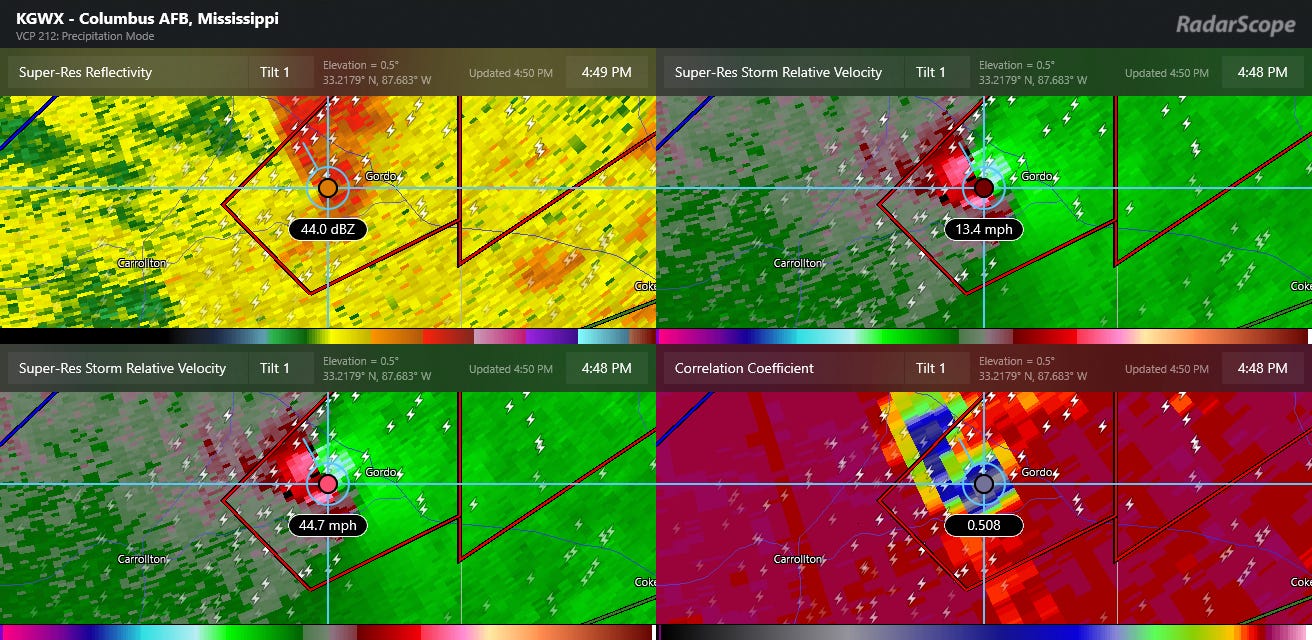
This storm developed a very large TDS with low CC values; not only did it obviously pick up significant debris, the evolution of the storm caused an initial surge of debris to fan out in the northern part of the storm (seen above to the NW of Gordo) while the main tornado and TDS was farther to the south to the west-southwest of Gordo.
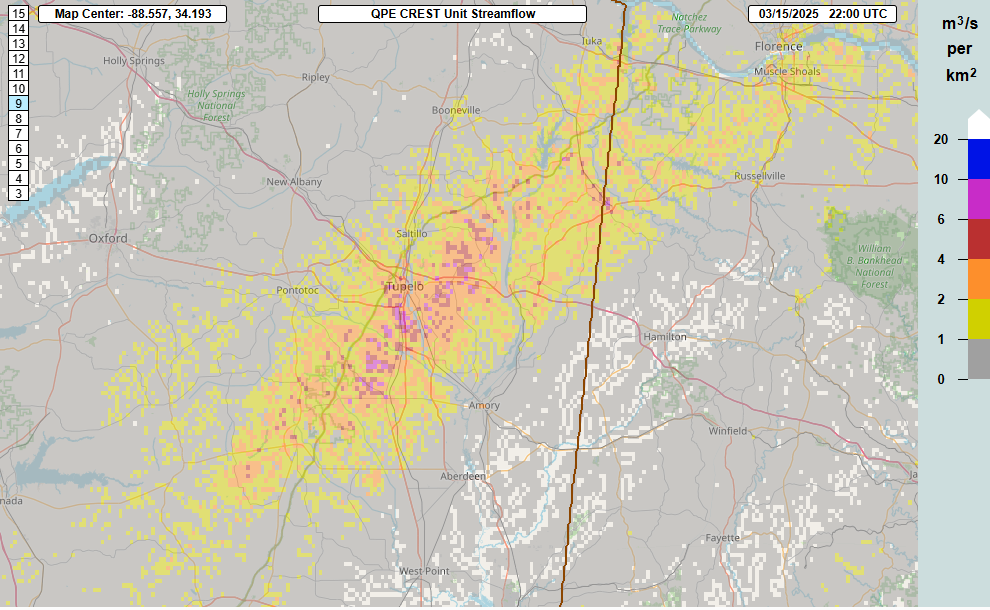
In addition to all of the severe weather activity, the repeated thunderstorms moving over the same area resulted in swaths of heavy rain of 3-6” over parts of northern Mississippi and the Tennessee Valley along with some flash flooding. The most significant flash flooding appears to have been in northeast Mississippi near Tupelo, where the MRMS FLASH hydrologic unit streamflow product (above) - which indicates inundation due to heavy rain and rapid runoff - showed values greater than 5 which implies potential significant flash flooding. There were reports of roads and buildings flooded in these areas.
Saturday Night
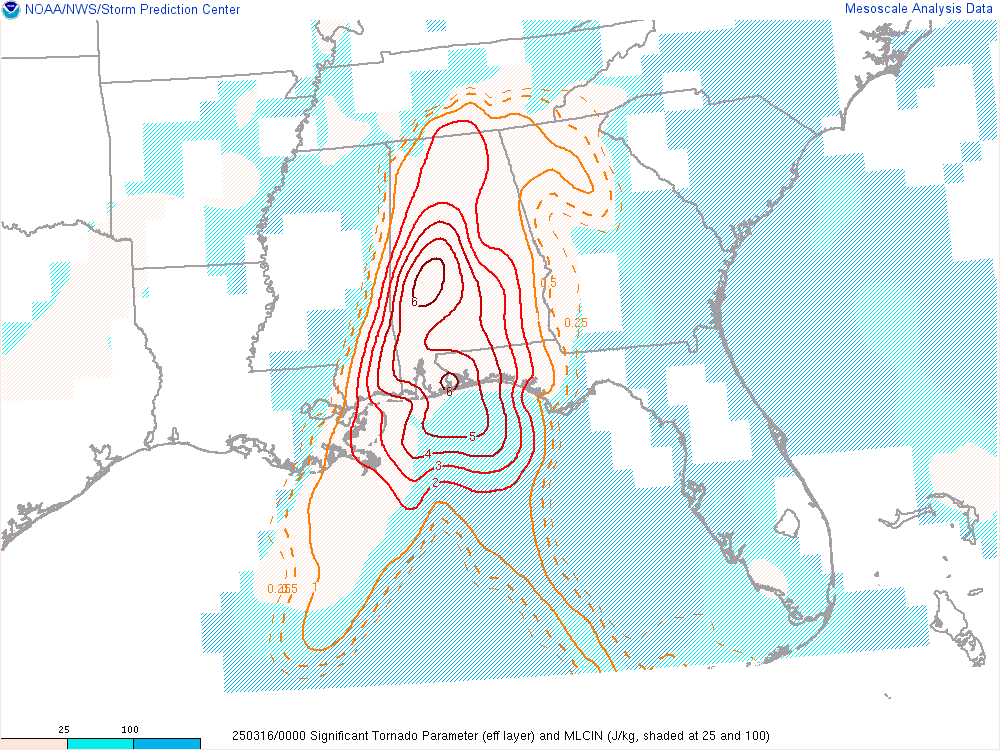
By mid evening storms were intensifying in an environment over Alabama becoming increasingly favorable for severe storms and tornadoes as shown by the SPC mesoanalysis Significant Tornado Parameter above. Low level moisture was increasing into areas east of I-65 increasing instability and resulting a more favorable environment for severe storms here as well.

The MRMS 4-hour rotation tracks product ending at 11 pm CT shows that several supercells with strong low level rotation moved through central Alabama during this time period, and several tornadoes did occur. One of the tornadoes (shown below) passed very close to the NWS Birmingham office and radar (actually located in Calera), forcing the staff to shelter and briefly pass warning operations to the NWS office in Atlanta/Peachtree City.

The most intense tornado of the night in Alabama occurred shortly before 9 pm to the southwest of Clanton as seen in the radar image below.

This storm exhibited very strong low level rotation on radar. One of the ways that meteorologists gauge the strength of a potential tornadic circulation on radar is by calculating the “gate-to-gate Delta-V” which is essentially the strongest inbound and outbound wind velocity pixels that are next to each other. For this storm, the values reached about 120 kt, which is quite intense and indicative of a significant tornado. In this case, NWS Birmingham rated this tornado as an EF-3 that had a path length of just under 25 miles. Unfortunately, 2 fatalities occurred with this tornado.

As is often the case in Southeast severe weather events, the severe weather risk continued through the night; an 5 mile long EF-1 tornado occurred around 6:30 am ET with the rotation track south of Albany, GA in the MRMS product shown above.
That brings us to the end of day 2 of this major severe weather episode, and to the end of part 2 of this article. I will finish it up in the next day or so with part 3, a discussion of Sunday’s severe weather in Pennsylvania and New York and an overall summary of the event and the forecasts. Again, if you have read this far, I would appreciate any comments you have about this sort of article and what I might be able to do to make it better from your perspective.
The maps are incredible