


Recapping the March 14-16 Event
Part 1: The lead up and March 14th

My talented friend Marshall Ramsey - I’m not sure what to call him because he does so many things well, cartoonist, author, journalist, broadcaster, etc. - drew this cartoon back about a decade ago when I was meteorologist-in-charge of the NWS Jackson, MS office, and has openly stated that I was the inspiration for the male character in the cartoon. He drew it to illustrate the hazards being visited upon Mississippi by an intense March storm system similar to the one our country experienced last week. While this is obviously a light hearted cartoon that has now been shared widely over the years at NCAA March Madness time, it illustrates a very important point: March weather can be violent and destructive in a variety of different ways. The massive storm system we experienced over the last week was a classic and potent reminder of this.
One of the things I want to use this Balanced Weather Substack for is to help bring people behind the scenes of meteorological operations and understand what goes into forecasts and warnings. So I want to take this recent major extended event as an opportunity to experiment with a “long form” article that provides a chronological breakdown of the meteorology, in the hopes of giving some scientific perspective on what happened, how meteorologists forecasted and warned for the hazards, and a summary of the tremendous societal impacts this weather system caused.
If you’re following Balanced Weather just to stay up to date with the weather, you may want to skip out on this article. But if you’re here to learn more about meteorology -the science and the tools - read on. I would appreciate comments and questions once you have read this article to help me refine the content for Balanced Weather going forward.
March 11-13
A discussion of a weather system such as this could go back many days to describe the atmospheric evolution that led to its development, but for the sake of brevity I am going to just talk about the 3 days leading up to the main events of March 14-16.

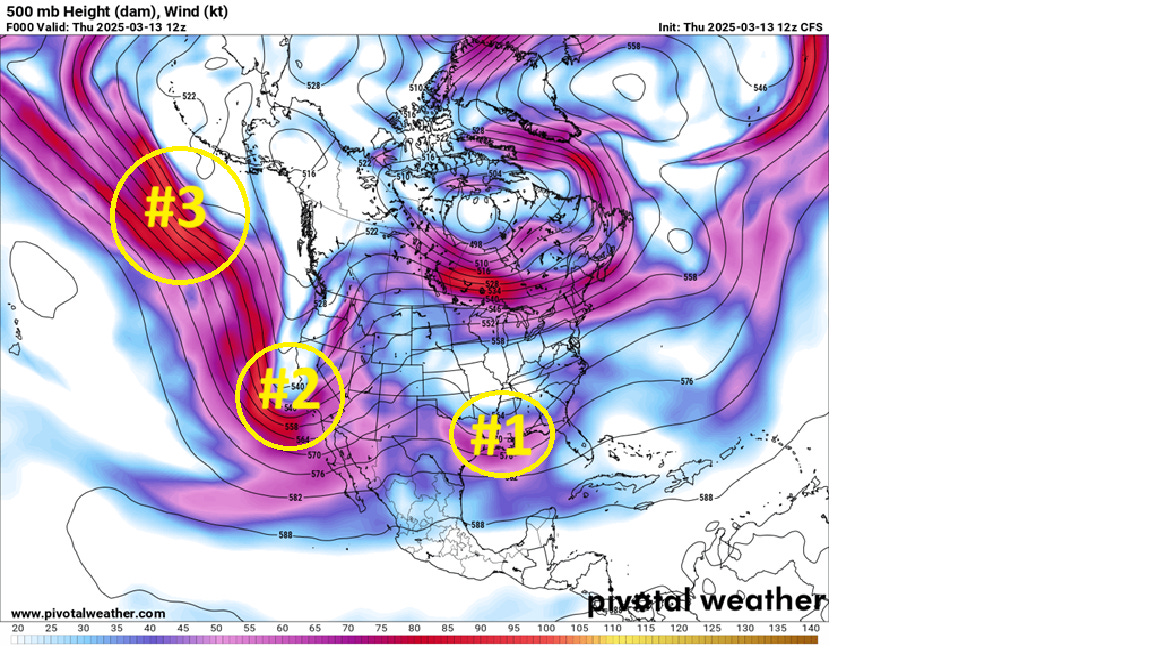
This weather chart shows the heights (the lines, similar to pressure on a surface weather map) and wind speeds (filled colors) at 500 millibars (mb) - about 18,000 ft above ground level - last Tuesday morning. Meteorologists use 500 mb extensively in weather forecasting as it typically best depicts the overall waves and disturbances in the mid and upper levels of the atmosphere that drive our weather on the ground. I have highlighted the 3 weather disturbances that played the key roles in last weeks impactful weather events: #1 coming into Southern California, #2 south of Alaska, and #3 way out in the north Pacific.

Now we move to the morning of Wednesday, March 12th. System #1 has moved east into the southern Rockies, and as it moves farther east during the next 24 hours it will spawn a band of strong to severe thunderstorms with a few reports of severe weather in the Arklatex region. Of more importance for later in the week though, it starts the return of moisture northward from the Gulf into the Arklatex and lower Mississippi Valley. This will play a role in the severe weather Friday/Saturday. Meanwhile, system #2 is now approaching California where it will produce a couple of bands of severe thunderstorms that cause some damaging winds in California and a late night tornado in the Los Angeles metro area (see below). System #3 has moved east, but is still way out in the north Pacific.

By Thursday morning, lead system #1 had moved to the lower Mississippi Valley where it would be responsible for scattered strong to severe storms that produced a handful of reports of severe hail and wind in the Southeast. System #2 was pulling across southern California where it would produce one of the better precipitation events (widespread .25 to 1” amounts) for Arizona in many months. System #3 has weakened as it has moved east to south of the Aleutians.
Friday, March 14th
(Note: for the next 3 days, the “day” will run from 7 am CT to 7 am the following day to keep things oriented with how meteorologists primarily define a day)
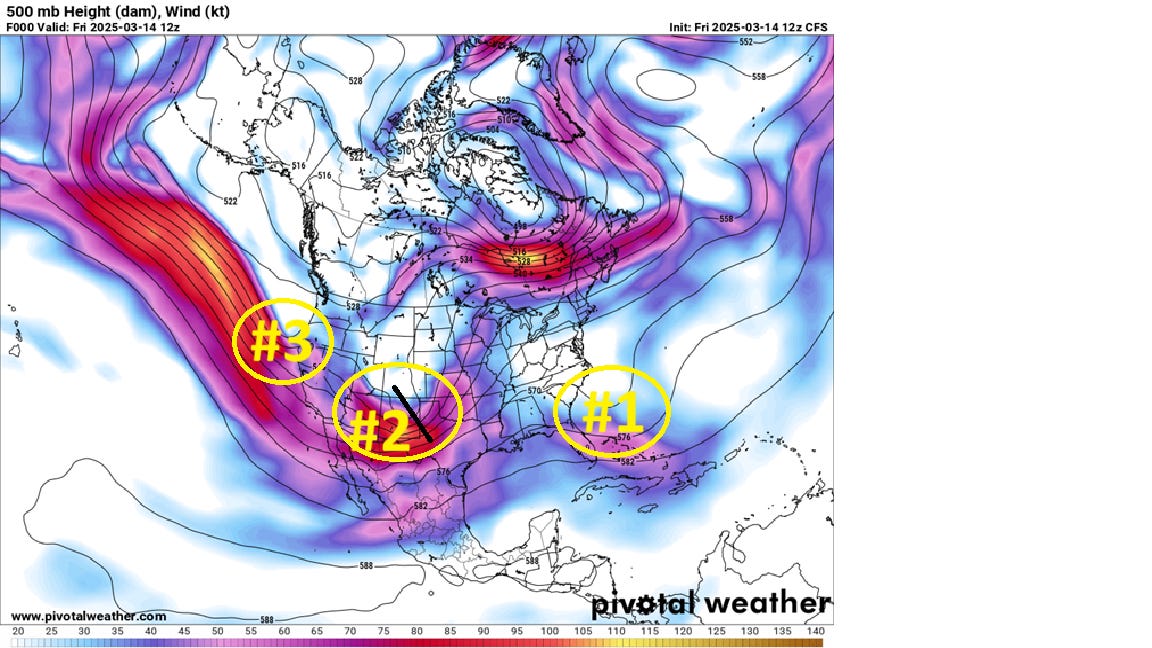
By Friday morning, our initial system #1 has pushed off the Southeast US coast. It’s not completely done influencing the evolution of events, though. While this initial system helped get moisture flowing north initially in the Mississippi Valley, its track so far south will disrupt the flow of Gulf moisture farther east in eastern Alabama and Georgia, helping to keep Saturday’s severe storm activity focused farther west.
System #2 has now moved into prime position to start causing major headaches, ejecting out into the Southern Plains. As shown by the black line, the axis of the trough has also become what meteorologists call “negatively tilted,” meaning it is oriented northwest to southeast. Negatively tilted troughs tend to have stronger forcing for lift in the atmosphere that causes precipitation and thunderstorms. The yellow shading in the base of the trough shows that it has winds of greater than 100 knots associated with it, also very impressive and indicative of the strong winds throughout the atmosphere the system contained. System #3 has finally reached the west coast and will be a major player over the weekend.
Midday into Mid Afternoon Friday
As we approached midday Friday, system #2 was causing multiple things to happen in the atmosphere that were either hazardous already or would contribute to hazards later in the day. This visible satellite loop depicts them very well. First, you can see the rotation associated with the center of system #2 lifting into the Oklahoma Panhandle. South of it, intense winds were beginning to pick up swaths of blowing dust which can be seen moving into Oklahoma. By this time, intense winds have already been causing major impacts in parts of the Plains; Amarillo gusted to 83 mph and numerous traffic incidents associated with high winds and blowing dust occurred. Meanwhile, low clouds can be seen streaming north over the Deep South, indicative of the low level moisture being pulled north ahead of the system that will result in severe thunderstorm development in a couple of hours. A lead impulse ahead of the core of system #2 is causing a band of elevated thunderstorms from eastern Kansas to western Arkansas.
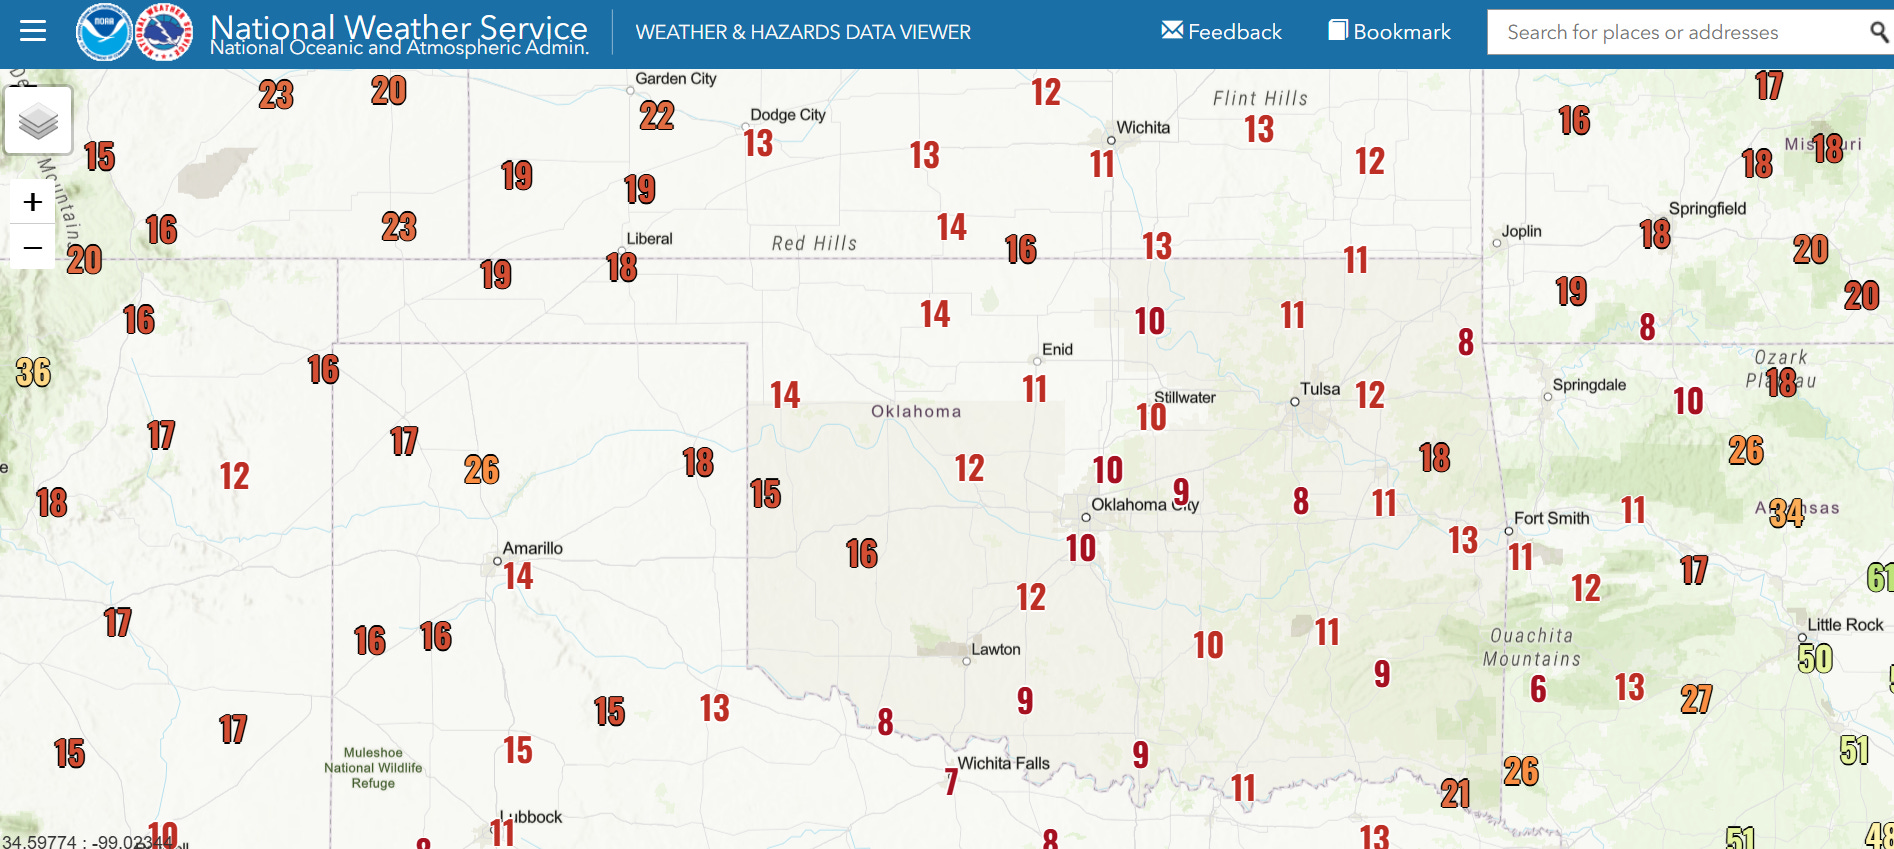
By early afternoon, fire weather conditions were becoming serious across Oklahoma. I posted to BlueSky the 12:45 pm Oklahoma Mesonet wind observations and a shortwave infrared (IR) satellite image highlighting hotspots that indicated a few wildfires had broken out.
Within the next hour, conditions deteriorated even further and a number of wildfires rapidly broke out. The core of the worst conditions moved across central Oklahoma toward southeast Kansas, with surface relative humidity values below 15% and winds gusting to 65 mph.
By mid afternoon, the shortwave IR imagery showed that numerous fires had exploded across that region, and a few fires had cropped up as far as east as southwest Missouri.

As they always do, the National Weather Service in Norman worked with state and local emergency managers, fire officials and other government entities to issue fire warnings and evacuation notices directly to the public. During fire weather conditions like Friday, NWS forecasters monitor satellite imagery continuously looking for new hotspots and warn local officials about developing fires. NWS meteorologists use satellite data, radar, Mesonet and other observations to provide continuous information to officials through radio, phone, and the NWSChat software that core NWS partners have access to. When weather conditions are as volatile and changeable as they were Friday (max winds and lowest RH shown below), this information is absolutely critical for effective firefighting, for keeping firefighters safe, and for keeping the public safe by allowing timely evacuations.

While damage and impacts from Friday’s wildfires are still being tallied, Oklahoma Department of Emergency Management has reported that more than 400 homes were damaged or destroyed by the wildfires; at least 74 homes in and around Stillwater, home of Oklahoma State University, were destroyed. Four people were killed in incidents related to the wildfires and winds in Oklahoma.
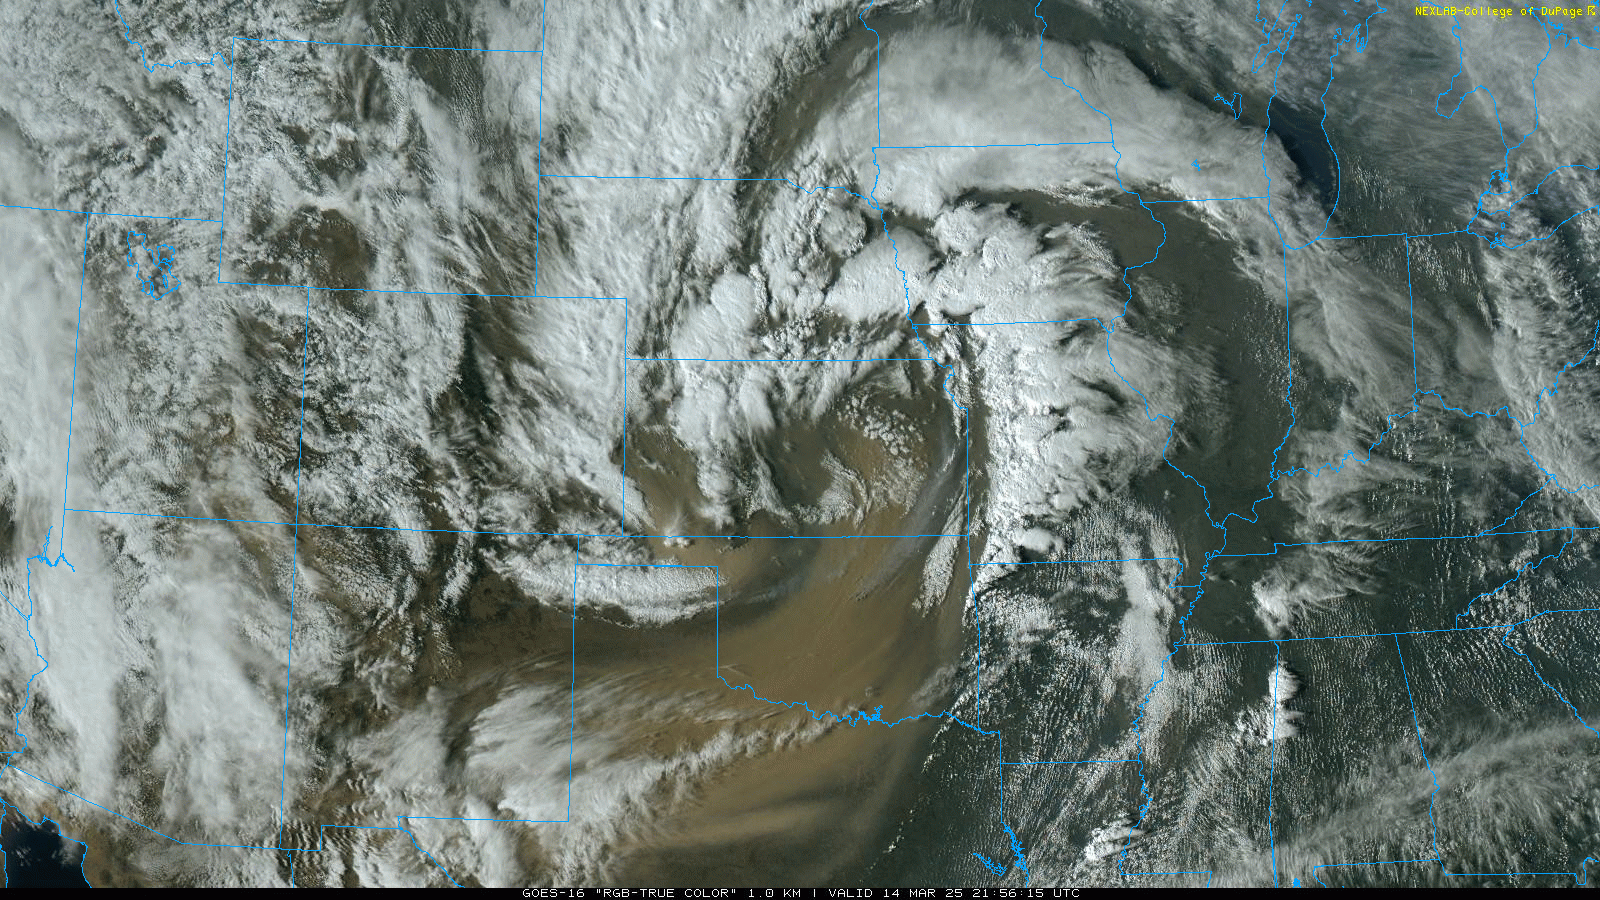
Blowing dust was also a huge issue Friday afternoon. This true color satellite information showed the huge extent of blowing dust that extended from eastern Kansas across much of Oklahoma down into central Texas. This dust caused significant travel and potential respiratory health issues; the dust ended up being carried well downstream across the Midwest and Great Lakes causing poor air quality on Saturday.
Late Afternoon into Evening Friday
On the 5 pm visible image above, you can see the arcing band of severe thunderstorms that had formed by this time from central Iowa down into northwest Arkansas. Even though system #1 had gotten the northward flow of low level moisture started ahead of system #2, moisture was still not particularly impressive for a severe weather outbreak. Dewpoint values - the parameter meteorologists typically use to gauge moisture levels - were only in the 50s across Missouri ahead of the developing band of severe storms, and if moisture had been even a bit less the severe weather in this area would likely not have been as widespread or impactful. However, in the end the intense upper level forcing provided by the strong, negatively tilted ejecting upper system and cold mid level temperatures compensated for the limited moisture, and widespread severe storms resulted.
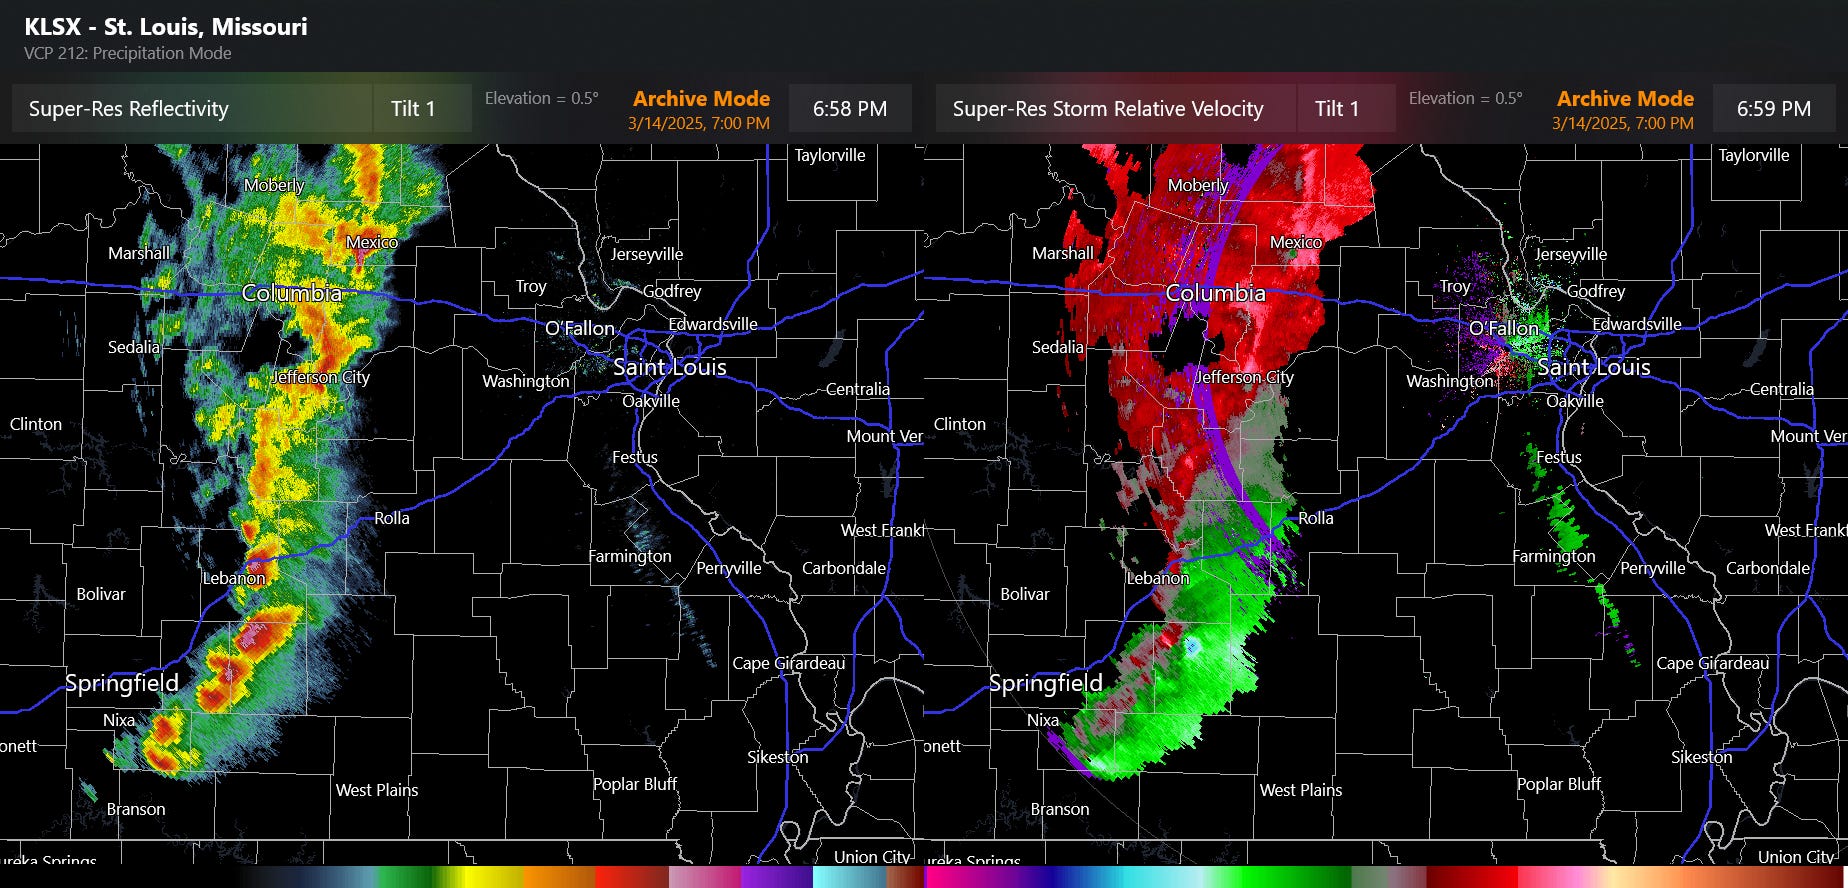
At 7 pm CT, the St. Louis WSR-88D (above) showed an intense band of severe thunderstorms bisecting Missouri. The storms at this time were still at least what we would consider “semi-discrete,” in other words it was not a solid squall line (or quasi-linear convective system, QLCS) but rather a number of supercells. You can see rotation with the supercells in the velocity data on the right; of particular note is strong rotation that can be seen just east northeast of Springfield where you can see an area of bright blue (strong inbound winds) next to an area of bright red (strong outbound winds) with a particularly intense supercell storm.

By 9 pm, the band of storms was now approaching the St. Louis metropolitan area. We’ll focus in on a couple of areas that resulted in particularly significant impacts. While you can see particularly bright/strong area of inbound/outbound velocity values (i.e., velocity couplet) near Salem, we are going to focus on the supercell west of St. Clair.
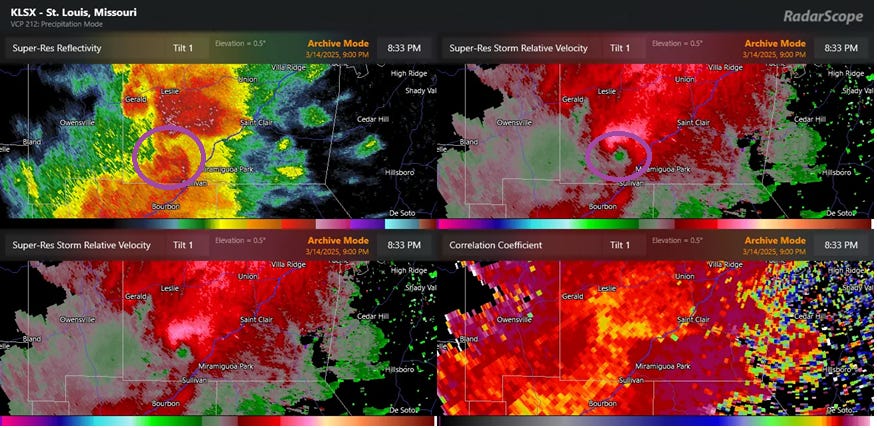
Even embedded in the line, this storm in reflectivity data (upper left) has the clear shape of a supercell storm with a hook-like feature just northwest of Sullivan. A velocity couplet is apparent as highlighted by the purple circle in the upper right; you can see a small area of green (wind blowing toward the radar site which is in the upper right hand corner of the images) and a larger, more intense area of red outbound winds. While this may not be as visibly strong as what we see near Salem as I discussed above, this couplet is much closer to the radar site meaning it is much lower in the atmosphere and closer to the ground than the rotation seen near Salem. This means it more directly correlates to a potential imminent tornado.

By about 10 min after the last set of images, at 8:42 pm the rotation has become a bit stronger. Also, in the lower right hand image, we can see an area of green collocated with the rotation. This radar product is correlation coefficient (CC), a dual-polarization radar product that essentially determines the size and shape of the objects being detected by the radar beam. Lower values of CC mean that the objects being detected are more different in shape, and in this case, the lower values mean that the radar is detecting debris lofted by a tornado. This signature is known as a tornadic debris signature or TDS, and enables meteorologists to be able to use radar to confirm the presence of a tornado, even if it’s in an area with no spotters or storm chasers or not visible due to rain, nighttime, etc.

Eight minutes later at 8:50 pm, the rotation is clearly weakening, but the TDS has actually become more distinct in the CC data, with blue values appearing, indicative of even lower CC values and likely more debris. This is not uncommon; even though the tornado is likely dissipating by this time, the lofted debris remains in the air longer than the tornado itself and thus the TDS often is detectable for several minutes after the dissipation of the tornado. You can also see that the weakening rotation is no longer collocated with a “hook” feature, and that actually a new hook-like feature is developing to the southeast just to the northeast of St. Clair. This is another very typical evolution of tornadic storms; the original tornado is becoming choked off by colder air or “occluding” while a new circulation and potential tornado is developing to the southeast where there is warmer, more buoyant air to be tapped by the storm.
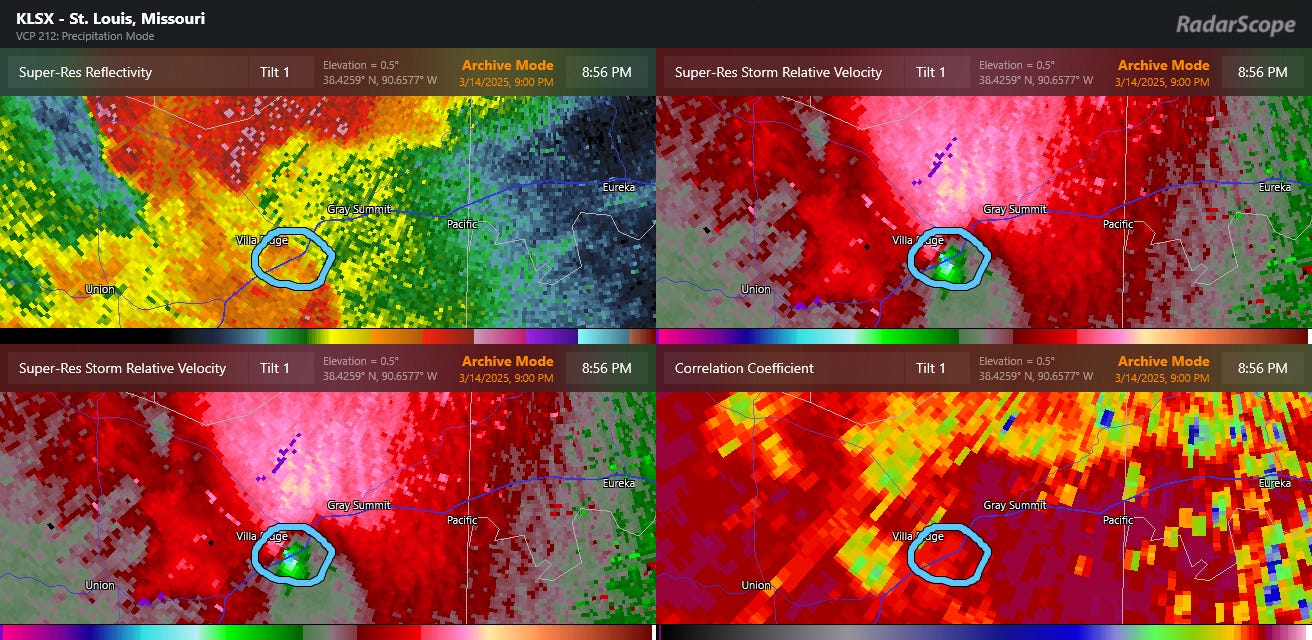
Just six minutes later the rotation with the original tornado is northwest of Villa Ridge and almost completely dissipated, while a new tornado has likely formed on the southeast side of Villa Ridge. The rotation here is now very strong and tight - the blues and reds are right next to each other, and the values of 85 mph toward the radar and 60 mph away are quite strong. All of this indicates that there is likely a significant tornado in progress. While there is not yet a TDS at this time, just 3 minutes later (image below) a large TDS is clearly visible in the lower right CC data on the northwest side of Gray Summit. You can also see a small area of higher reflectivity in the upper left hand image in the same location as the TDS; this is a reflectivity “debris ball” where the radar is detecting higher reflectivity due to more reflective tornadic debris (building materials, roofing, etc.) being lofted by the tornado. Wind velocities have also increased with maximum values near 100 mph being detected. This tornado has already been surveyed by NWS St. Louis and rated as an EF-2 with maximum winds of 130 mph.
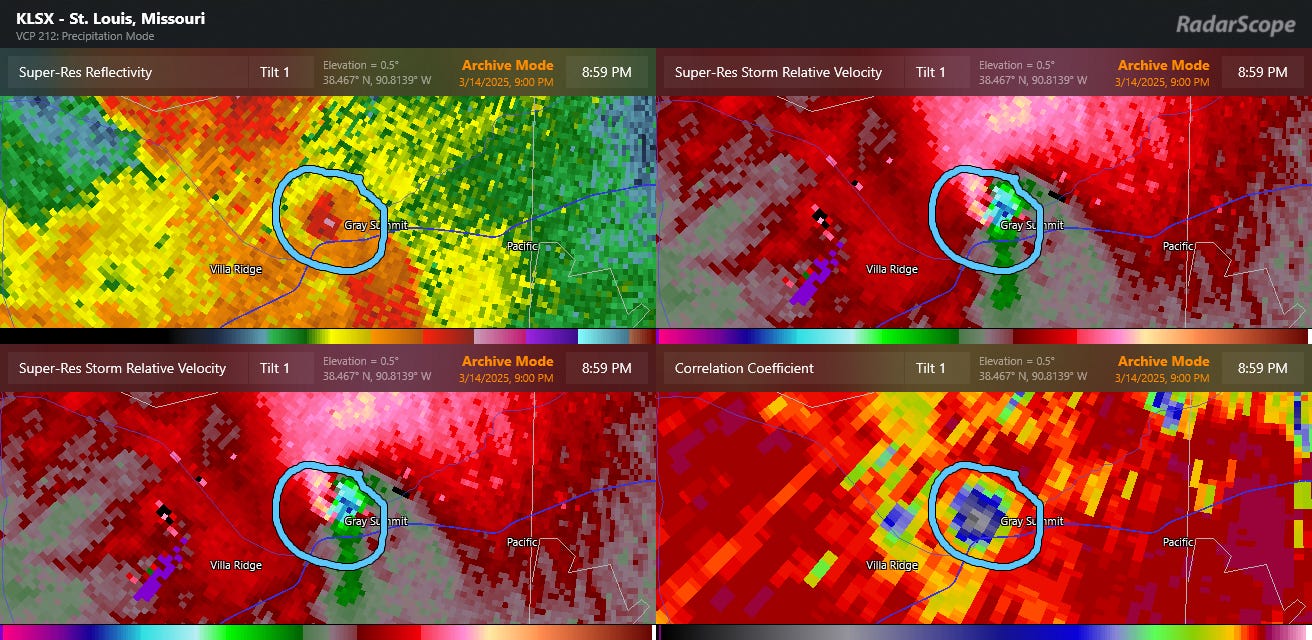
A couple of things I’d like to emphasize. First, the evolution with these severe storms often happens very rapidly as seen here; the second tornado went from a nascent circulation to a full blown significant tornado in less than 10 minutes. This is why NWS meteorologists must be continually looking at radar data during severe weather; and why so much research effort at the National Severe Storms Laboratory has focused on new radar techniques to shorten the amount of time needed for the radar to gather data (e.g., phased array radar), and also to develop algorithms and AI techniques to help meteorologists quickly synthesize data to help with warnings. Secondly, NWS severe weather warning operations are not just about deciding when and where to issue a warning; NWS meteorologists are also conveying information to the public and core partners about whether a tornado is confirmed and its potential intensity. Social science has shown that this sort of information helps people contextualize warning information and spurs protective actions to be taken more quickly.

By 9:45 pm the main band of storms was now moving through the St. Louis metro area. The band of severe storms caused several additional tornadoes through the St. Louis area which are still being surveyed, along with straight line wind damage and large hail. In this 9:45 pm radar image above, you can also see several distinct supercells over south central Missouri and north central Arkansas that I have circled. These will be the focus of the late night period.
Late Evening into the Overnight Hours

By about 11:30 pm, the Little Rock radar showed a parade of scattered supercells extending from southeast Missouri across Arkansas, with another lone supercell over north central Mississippi. The forcing from our system #2 was not as strong here as further to the north in Missouri and Iowa, but the low level moisture and instability were much greater. The combination of less atmospheric forcing but greater instability yielded more scattered but very intense thunderstorm development than farther north. The wind shear in the atmosphere was still extreme in this region, so many of these supercells produced significant tornadoes.
Likely the most intense tornado, which has already been rated an EF4, occurred near the community of Diaz in northeast Arkansas. Below is the four panel radar image from 11:28 pm, when it was near peak radar depicted intensity.
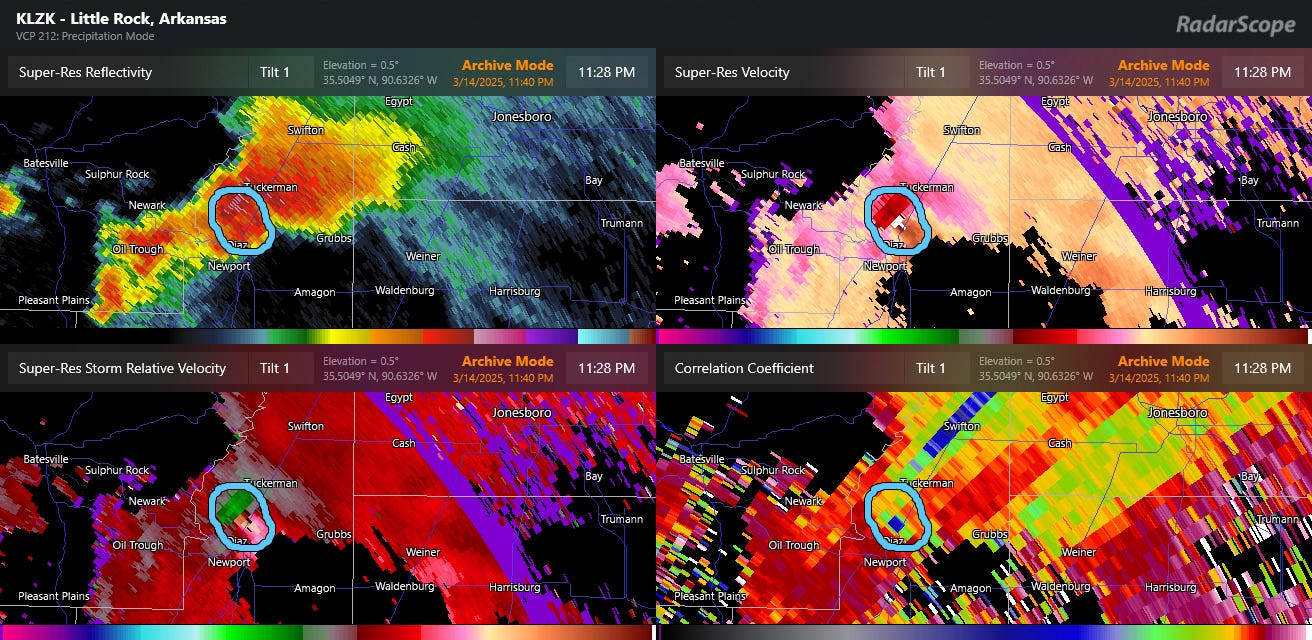
The storm is approximately 80 miles from the Little Rock radar, meaning the height of the radar beam above ground level is about 7,000 feet, which is rather high. Even at this elevation, the radar data is quite impressive. A TDS with low CC values can be seen at the blue spot in the lower right hand panel, and the rotational velocity couplet is particularly apparent in the lower left hand panel. That product is storm-relative velocity, where the motion of the storm cell is subtracted out of the radar’s wind velocity data; removing the motion of the storm often makes rotational couplets stand out more clearly. The actual base velocity data in the upper right has values at the top of the legend, with 140+ mph winds detected.
Not only does a TDS enable a meteorologist to confirm the presence of a tornado with radar, it also enables them to make an estimate of the potential intensity of the tornado. More than a decade of research using dual-polarization radar data has shown that the height above ground level that debris is detected in a storm has a correlation with the intensity of the tornado: the higher the debris, the more intense the tornado. When that information is combined with information about the strength of the rotation from the radar, relatively accurate estimates about the intensity of a tornado can be made in real time and used by the NWS meteorologists in their warnings.

This image above shows the data from a higher level tilt (1.7 degrees elevation instead of the lowest level 0.5 degree elevation), meaning we are looking at about 17,000 feet AGL. The TDS is still very clear at this height, and in other data I was able to see the TDS up to at least 20 Kft. This combined with the strong rotation would tell the forecaster that there was potential for this to be a high end, intense tornado, which in fact it was.
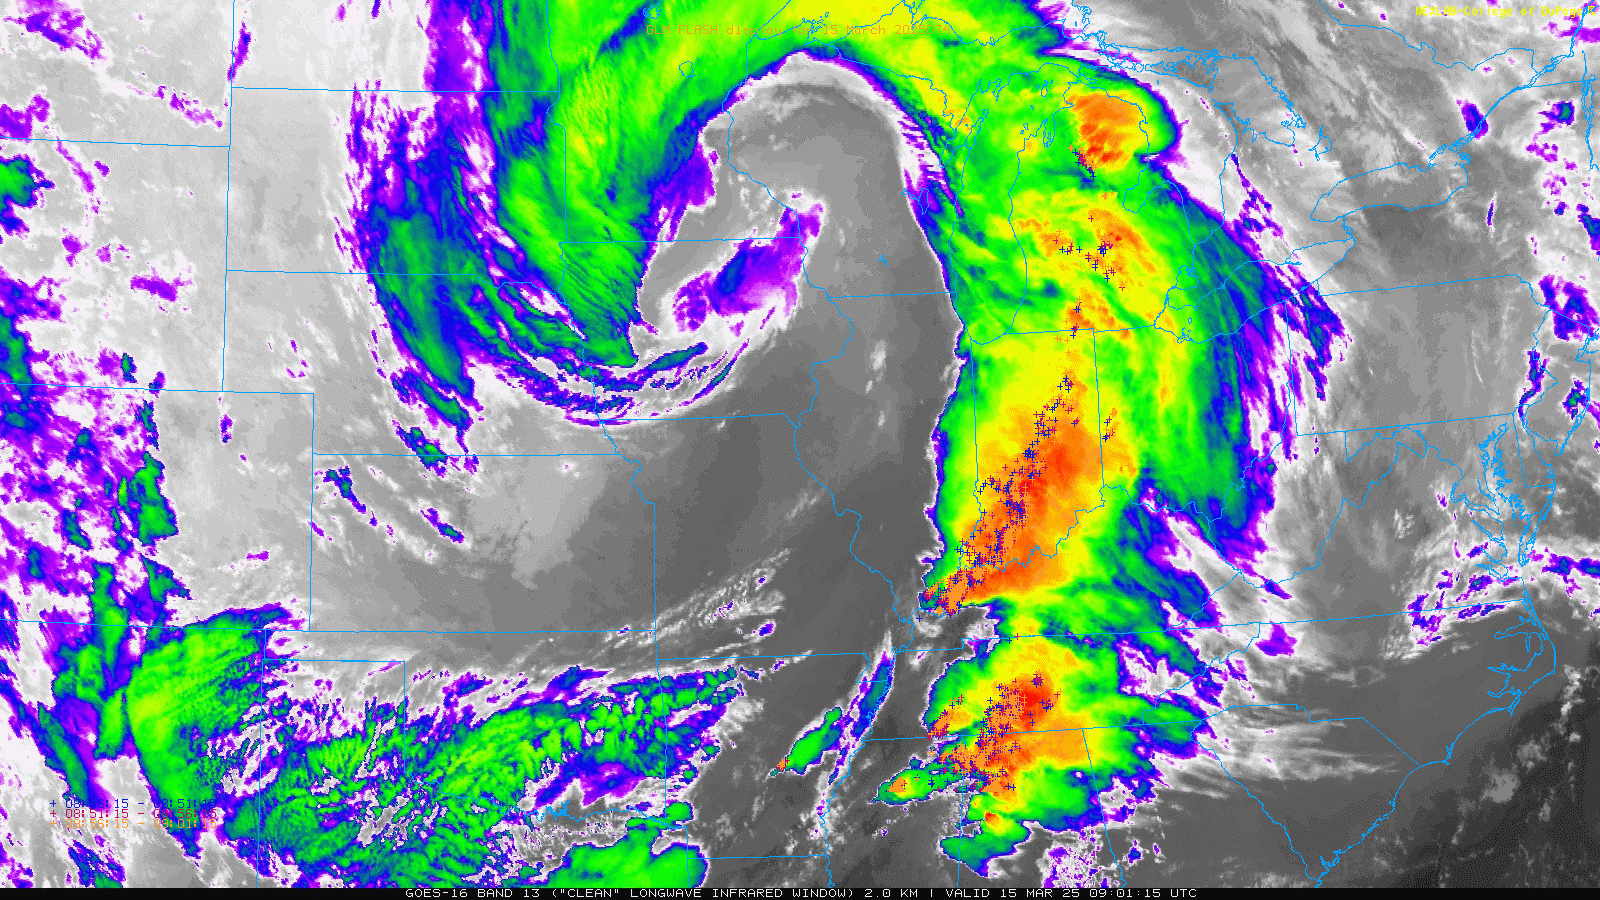
The above 4 am CT infrared satellite image with GOES satellite detected lightning data overlaid shows how the severe storms continued to push east and northeast over the next few hours, continuing to produce tornadoes, large hail and wind damage across Indiana and northern Kentucky. The full extent of severe weather reports from the 7 am-7 am period can be seen below.
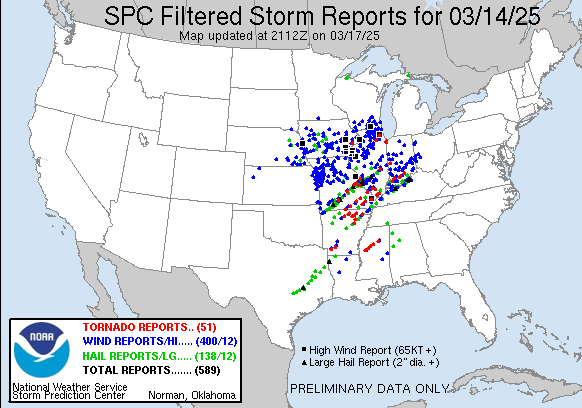
That brings us to the end of a remarkably active 24 hour period. The societal impacts from weather during this timeframe were dramatic, with hundreds of homes and businesses damaged and destroyed, and more than 20 lives lost.
While I will go into a bit more detail on forecast and warning performance in the second part of this article, I will say that from a preliminary look at things it certainly seems that the overall forecast and warnings from NWS for all aspects of this event were excellent. Considering the complexity and intensity of this event - as well as the external pressures NWS employees have had in recent weeks - this is particularly impressive.
It is probably worth making the point here that even though I was a long time NWS and NOAA employee, I will have no problem pointing out in Balanced Weather when there are deficiencies in the forecasts or warnings. I have a deep belief that given weather is a matter of life and death just like medicine, meteorologists must have a very similar attitude as doctors; we must evaluate our performance in a rigorous and scientific manner, and utilize those findings to improve our services. It is also important to use those findings to help people better understand and use our information; forecasts will NEVER be perfect and meteorologists must communicate the uncertainty and potential errors of a forecast to help people utilize a forecast to make the best decisions. Having said all this, I also deeply believe that NOAA/NWS meteorologists both in research and operations are some of the most dedicated, talented scientists in the world, and the atmosphere is finicky and difficult to predict and comprehend. So when I point out and explain situations where the forecast has went awry, it is about that inherent unpredictability, not about the people who are striving to serve the public as best they can.
I hope you found this journey through the science of the first half of this major weather event interesting and educational, again I invite comments, discussion and suggestions; I want Balanced Weather to serve its readers. Part 2 will be coming in the next day or so.